FVG BOS SMC Liquidity Analyzer - Ambrosia-Prime - Basic v1.0# 📘 USER GUIDE
# FVG BOS Volume Volatility Entry/TP/SL Liquidity Analyzer
## 🆓 FREE Basic v1.0 | by Ambrosia-Prime
---
## 📋 TABLE OF CONTENTS
1. (#what-is-this-indicator)
2. (#settings-explained)
3. (#understanding-the-tables)
4. (#your-first-trade)
5. (#free-vs-premium)
6. (#faq)
---
## 🎯 WHAT IS THIS INDICATOR?
The **FVG Analyzer** is a professional trading tool based on **Smart Money Concepts (SMC)** and **ICT strategies**. It automatically detects:
✅ **Fair Value Gaps (FVG)** - Market imbalances
✅ **Break of Structure (BOS)** - Trend confirmations
✅ **Multi-Timeframe Analysis** - 4H, 1H, 15m, 5m, 1m
✅ **Entry, Stop-Loss & Take-Profit** - Automatic level calculation
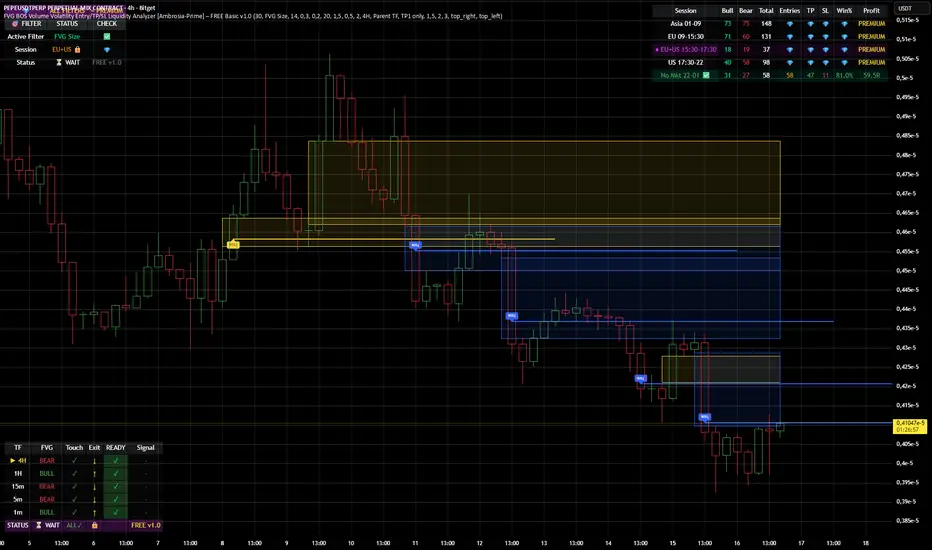
### The Debug Table shows you everything:
| TF | FVG | Touch | Exit | READY | Signal |
|-----|------|-------|------|-------|--------|
| ► 4H| BULL | ✓ | ↑ | ✓ | LONG |
| 1H | BULL | ✓ | ↑ | ✓ | LONG |
| 15m | BULL | ✓ | ↑ | ✓ | LONG |
When all timeframes show **READY** → **ENTRY SIGNAL!**
---
## ⚙️ SETTINGS EXPLAINED
### 👁 DISPLAY SETTINGS
| Setting | Description |
|---------|-------------|
| Show Bullish FVG | Display yellow FVG boxes |
| Show Bearish FVG | Display blue FVG boxes |
| Show BOS lines | Break of Structure lines |
| Show Session Stats | Statistics table (top right) |
| Show Debug Table | Cascade status (bottom left) |
| Show Entry/SL/TP | Entry lines on signals |
### 🎯 BASIC FILTER (Choose ONE)
In the **FREE Version** you can only activate **1 filter** at a time:
| Filter | What it does |
|--------|--------------|
| **None** | No filter active |
| **FVG Size** | Only FVGs larger than X × ATR |
| **Volume** | Only on above-average volume |
| **Volatility** | Only on normal volatility (not too wild) |
| **BOS only with FVG** | BOS only when open FVG exists |
| **Fill Delete** | FVG disappears when completely filled |
> 💎 **PREMIUM:** Use all 15+ filters simultaneously!
### 🔄 TOUCH + EXIT CASCADE
| Setting | Options | Recommendation |
|---------|---------|----------------|
| Cascade Parent TF | 4H, 1H, 15m | **4H** for Swing |
| Confirm EXIT by WICK | ON/OFF | **ON** for more signals |
| Entry Trigger Level | Lowest/Middle/Parent | **Parent TF** |
| Require ALL TFs | ON/OFF | **ON** for quality |
### 📊 TP SETTINGS
| Setting | Description |
|---------|-------------|
| TP Mode | TP1 only / TP1+TP2 / TP1+TP2+TP3 |
| TP1 Risk:Reward | e.g. 1.5 = 1.5× your risk |
| TP2 Multiplier | e.g. 2.0 = 2× TP1 |
| TP3 Multiplier | e.g. 3.0 = 3× TP1 |
---
## 📈 UNDERSTANDING THE TABLES
### 📍 Filter Status (Top Left)
```
┌─────────────────────────────────────┐
│ 💎 │ ALL FILTERS │ = PREMIUM │
├─────────────────────────────────────┤
│ Active Filter │ FVG Size │ ✅ │
│ Session │ EU 🔒 │ 💎 │
│ Status │ ⏳ WAIT │FREE v1.0│
└─────────────────────────────────────┘
```
- **Active Filter:** Your selected filter
- **Session:** Current trading session
- 🔒 = Locked (PREMIUM only)
- ✅ = Unlocked (No Market 22-01 CET)
- **Status:** WAIT / 🟢 LONG / 🔴 SHORT
### 📊 Session Stats (Top Right)
```
┌──────────────────────────────────────────────────────────┐
│ Session │Bull│Bear│Total│Entries│TP│SL│Win%│Profit│
├──────────────────────────────────────────────────────────┤
│ Asia 01-09 │173 │161 │ 334 │ 💎 │💎│💎│ 💎 │PREMIUM│
│ EU 09-15:30 │131 │146 │ 277 │ 💎 │💎│💎│ 💎 │PREMIUM│
│ EU+US 15:30-17:30│ 37 │ 42 │ 79 │ 💎 │💎│💎│ 💎 │PREMIUM│
│ US 17:30-22 │ 95 │106 │ 201 │ 💎 │💎│💎│ 💎 │PREMIUM│
│ No Mkt 22-01 ✅ │ 42 │ 52 │ 94 │ 14 │14│ 0│100%│ 9.8R │
└──────────────────────────────────────────────────────────┘
```
**In FREE you see:**
- ✅ Bull/Bear/Total FVGs for **ALL** sessions
- ✅ Complete stats only for **No Market (22-01 CET)**
- 💎 Other sessions = **PREMIUM**
### 🔍 Debug Table (Bottom Left)
Shows the **live status** of the cascade:
| Symbol | Meaning |
|--------|---------|
| ► | Parent timeframe (selected) |
| BULL/BEAR | FVG direction |
| ✓ (Touch) | Price touched the zone |
| ↑/↓ (Exit) | Price exited the zone |
| ✓ (READY) | Timeframe is ready |
| LONG/SHORT | Signal direction |
---
## 🚀 YOUR FIRST TRADE
### Preface - Why this Indicator is Different
This indicator can filter so **aggressively** that you receive few or almost no signals. **That was exactly my goal!**
I don't need 500 entries per day staring at a chart all day long.
**I only need 1-3 signals per day - and they should work.**
That was the goal. Quality over quantity.
---
### Step-by-Step Guide:
**1. Create a Watchlist**
- Create a watchlist in TradingView
- Add as many charts as your account allows
- Add the indicator to all charts
**2. Set up Alerts**
- Go to the **4H chart**
- Set up the alert:
- **FREE:** Only "No Market" session (22-01 CET)
- **PREMIUM:** All sessions available
- Select "Any Entry Signal"
**3. React to Alert Signal**
- When an alert comes → Switch to the chart
- Check the **Session Stats Table** (top right)
- There you see: Entry, TP, SL, Win%, Profit
**4. Optimize Entry**
- Open the **Settings** (gear icon)
- Adjust the **TP** until you win all trades
- *(Sometimes profit is higher when you lose one trade but have a higher TP)*
- When you've found the best profit result:
- **Take the set TP minus 10-20%**
- *(We don't want to be greedy, but we want to win!)*
**5. Manage Trade**
- The **SL price** is already provided
- The **TP price** adjusts to your settings
- Set your trade accordingly
**6. Done!**
- Start the trade
- Wait for the next signal on another chart
- Repeat!
---
### ⚠️ Important Note
> Remember: A trade can always hit SL!
> Only trade with money you can afford to lose.
>
> I wish you great success and let me know how successful you were.
> **I will read every comment and answer to the best of my ability.**
---
## 💎 FREE vs PREMIUM
### *Coming soon - Currently in Release Testing*
### What you get with FREE:
| Feature | FREE 🆓 |
|---------|---------|
| FVG Detection (all TFs) | ✅ |
| BOS Detection | ✅ |
| Cascade Logic | ✅ |
| Debug Table | ✅ |
| Session Stats Table | ✅ |
| Entry/SL/TP Lines | ✅ |
| Filters | **1 at a time** |
| Trading Sessions | **Only No Market (22-01)** |
| Alerts | **Only No Market** |
### What you get with PREMIUM:
| Feature | PREMIUM 💎 |
|---------|------------|
| Everything from FREE | ✅ |
| **15+ filters simultaneously** | ✅ |
| **All sessions unlocked** | ✅ |
| → Asia (01-09) | ✅ |
| → EU (09-15:30) | ✅ |
| → EU+US Overlap (15:30-17:30) | ✅ |
| → US (17:30-22) | ✅ |
| **Alerts for all sessions** | ✅ |
| **Session-based TP optimization** | ✅ |
| **HTF Zone Confluence Filter** | ✅ |
| **Structure Filter (HH/HL/LH/LL)** | ✅ |
| **RR Filter** | ✅ |
| **Trend EMA Filter** | ✅ |
| **Candle Quality Filter** | ✅ |
| **Cooldown Filter** | ✅ |
| **FVG Age Filter** | ✅ |
### 🚀 PREMIUM EDITION (Exclusive!)
The Premium version has **two different entry logics** - that's why the testing phase is still ongoing.
Finds setups with **10-100% potential!**
---
## ❓ FAQ
### "Why don't I see any entries?"
**Possible reasons:**
1. **Wrong session:** FREE only works 22:00 - 01:00 CET
2. **Cascade not READY:** All TFs must show ✓
3. **Filter blocking:** Check your active filter
4. **Already in trade:** "Single Trade" allows only 1 trade
### "What do the colors mean?"
| Color | Meaning |
|-------|---------|
| 🟡 Yellow | Bullish FVG / Entry line |
| 🔵 Blue | Bearish FVG |
| 🟢 Green | TP line / Positive |
| 🔴 Red | SL line / Negative |
| 🟣 Purple | EU+US Overlap Session |
### "Which timeframe should I use?"
| Your Style | Chart TF | Cascade Parent |
|------------|----------|----------------|
| Scalping | 1m - 5m | 15m |
| Daytrading | 5m - 15m | 1H |
| Swing | 15m - 1H | 4H |
### "Can I change the sessions?"
- **FREE:** No, only No Market (22-01) is available.
- **PREMIUM:** Yes, all sessions + session-based TP values!
---
## 📞 WANT MORE?
### Unlock PREMIUM:
- ✅ All Sessions
- ✅ All Filters
- ✅ 2 Entry Logics
- ✅ Priority Support
### Contact & Support:
📊 **TradingView:** (www.tradingview.com)
---
## 📜 CHANGELOG
### v1.0 FREE (December 2024)
- Initial Release
- Multi-TF FVG Detection
- BOS Detection
- Cascade Logic
- 1 Filter (Dropdown)
- No Market Session (22-01)
- Session Statistics
- Debug Table
---
## ⚠️ DISCLAIMER
This indicator is an **analysis tool** and not financial advice.
Trading involves risks. Past results do not guarantee future profits.
Only trade with capital you can afford to lose.
---
**Good luck with your trading! 🚀**
*Your Ambrosia-Prime*
---
*© 2024 Ambrosia-Prime. All rights reserved.*
In den Scripts nach "take profit" suchen
90% WR Buy/Sell Cloud ( Infinite money glitch) The Cheat code:The Official Manual Tradingview took down my last indicator..?
Maybe it was working too well..
Disclaimer: I am not a financial advisor. I do not give financial advice. This indicator and my commentary are for educational purposes only. You are responsible for your own trades.
I built this indicator to show you exactly what I see in the market. The coding is complex so your decision-making can be simple. Here is how to use common sense and read the chart properly to replicate the structure I see.
1. General Trading Principles (The Mindset)
To succeed with this system, you need discipline.
Take Profits: Do not be greedy. When the move happens, pay yourself.
Use Stop Losses: Protect your capital. Never let a trade run wild.
The -99% Rule: You should never hold a position—mine or anyone else's—down to -99%. If the structure breaks, get out.
Be Active: Have your charts pulled up. If you have the indicator on your screen, you don’t need to wait for anyone to tell you what to do—the exit signals are right there.
2. The "Box of EMAs" (Your GPS)
This feature is literal. It removes the guesswork.
Red EMAs Going Down: The market is bearish. We are going down. Do not look for buys.
Curling Up: Bullish momentum is starting.
The Strategy: Use this to confirm the trend on Higher Time Frames (30m to Daily). If your Daily and 4-Hour EMAs are curling, the probability is in your favor.
3. The Cloud (Structure & Refusal)
Think of the Cloud as the floor or the ceiling.
Below the Cloud: It acts as Resistance. Look for price to hit the cloud and reject (Refusal).
Above the Cloud: It acts as Support. Look for the bounce.
The Rule: If the Box of EMAs is red and you are below a red Cloud, do not fight it. The trend is your friend until it bends.
4. Clean Up Your Charts
I added extra features because people asked for them, but for the best results, turn off the noise.
My Recommended Setup:
KEEP: Order Blocks, The Cloud, Buy/Sell Signals, Table Dashboard.
TURN OFF: Everything else.
Why? You need clarity to see the structure, not clutter.
5. ***Hidden***
6. The "False Signal" Myth (Read This)
I see people claiming "false signals" on the 5-minute chart. Let me be clear: There is no repaint.
Here is how the code works:
A signal may appear during the formation of a candle if conditions are met.
If price moves and those conditions are no longer met before the candle closes, the signal will disappear. This is not repainting; this is real-time data.
Repainting is when a signal pops up on a candle minutes or hours after it has already closed. My indicator does not do that.
Solution: Wait for the candle close to confirm the signal, or understand that an open candle is fluid.
I haven't lost using this and hopefully you don't either. I've debated on even posting this, as really it shouldn't even be out there—but for the lucky few that snag it, enjoy it while you can. Cheers.

Smart Money Swing Strategy [All-in-One]# Pro Swing Trader 📈
A comprehensive swing trading indicator for TradingView that combines multiple confluence factors to identify high-probability trade setups with built-in risk management.
## 🎯 Overview
This indicator is designed for swing traders who want to catch momentum pullbacks with precision entries. It filters trades using multiple timeframe analysis, RSI zones, volume confirmation, and EMA trends to deliver only the highest-confidence setups.
### Key Features
✅ **Multi-Timeframe Confluence** - Confirms trades with higher timeframe analysis (Daily, 4H, etc.)
✅ **Smart Entry Signals** - Detects pullback-to-EMA reclaim patterns
✅ **Automatic Risk Management** - Calculates stops, targets, and R-multiples
✅ **Dynamic Stop Loss** - ATR trailing stop + break-even automation
✅ **Real-Time HUD Dashboard** - Live confluence scoring and trade metrics
✅ **Comprehensive Alerts** - Entry, TP1, TP2, and stop-loss notifications
✅ **Visual Trade Levels** - Clear on-chart stop-loss and take-profit lines
---
## 📊 How It Works
### Signal Logic
The indicator identifies two types of signals:
**Base Signals** (Small triangles):
- Price pulls back between Fast EMA and Slow EMA
- RSI is in the swing zone (40-60 by default)
- Price reclaims the Fast EMA with momentum
- Optional: Volume spike confirmation
**High-Confidence Signals** (Large triangles):
- All base signal criteria met
- Higher timeframe confirms the trend direction
- HTF RSI and slope alignment
- These are your primary trade signals
### Entry Conditions
#### Long Entry (🟢 HC L)
1. Fast EMA > Slow EMA (uptrend)
2. Previous candle closed between the EMAs (pullback)
3. Current candle crosses above and closes above Fast EMA (reclaim)
4. RSI between 40-60 (swing zone)
5. **HTF Confirmation**: Daily/4H price above EMA50, RSI > 50, positive slope
6. Optional: Volume > 1.5x 20-bar average
#### Short Entry (🔻 HC S)
1. Fast EMA < Slow EMA (downtrend)
2. Previous candle closed between the EMAs (pullback)
3. Current candle crosses below and closes below Fast EMA (reclaim)
4. RSI between 40-60 (swing zone)
5. **HTF Confirmation**: Daily/4H price below EMA50, RSI < 50, negative slope
6. Optional: Volume > 1.5x 20-bar average
---
## 🎛️ Settings & Parameters
### Trend Parameters
- **Fast EMA**: Default 20 - Quick trend detection
- **Slow EMA**: Default 50 - Major trend filter
- **Swing Lookback**: Default 10 - Bars to find swing high/low for stops
### RSI Settings
- **RSI Length**: Default 14
- **RSI Min**: Default 40 - Lower bound of swing zone
- **RSI Max**: Default 60 - Upper bound of swing zone
### Risk Management
- **Final TP Risk-Reward (R)**: Default 2.0 - Main profit target multiplier
- **TP1 R Multiple**: Default 1.0 - Partial profit target
- **Use Break-even Stop**: Move stop to entry after 1R profit
- **ATR Trailing Stop**: Dynamic stop based on ATR(14) x 2.0
### Filters
- **Require Volume Spike**: Optional volume confirmation filter
- **Use Higher TF Confirmation**: Enable multi-timeframe analysis
- **Higher TF**: Default "D" (Daily) - Can use 240 (4H), W (Weekly), etc.
---
## 📈 Dashboard (HUD)
The top-center dashboard shows real-time confluence status:
| Column | Meaning |
|--------|---------|
| **Trend** | Current trend direction (UP/DOWN/Flat) |
| **HTF** | Higher timeframe alignment (Bull/Bear/Flat) |
| **RSI Zone** | Is RSI in swing zone? (YES/NO) |
| **Volume** | Volume spike detected? (YES/NO) |
| **Signal** | Active signal type (HC LONG/HC SHORT/None) |
| **R Risk** | Current profit in R-multiples |
| **Stop** | Current stop-loss level |
| **TP1** | Partial take-profit status |
| **TP2** | Final take-profit status |
| **Conf %** | Overall confluence score (0-100%) |
### Confidence Score Breakdown
- **20%** - Trend present (up or down)
- **30%** - HTF confirmation aligned (or 15% if HTF off)
- **20%** - RSI in swing zone
- **10%** - Volume spike
- **20%** - High-confidence signal triggered
**Scoring**:
- 🟢 70%+ = High probability setup
- 🟡 40-69% = Moderate setup
- 🔴 <40% = Low probability
---
## 🔔 Alert Setup
The indicator includes 8 alert conditions:
### Entry Alerts
- **HC LONG ENTRY** - High-confidence long signal triggered
- **HC SHORT ENTRY** - High-confidence short signal triggered
### Profit Target Alerts
- **LONG TP1 Reached** - Hit partial profit (1R by default)
- **LONG Final TP Reached** - Hit final target (2R by default)
- **SHORT TP1 Reached** - Hit partial profit
- **SHORT Final TP Reached** - Hit final target
### Stop Loss Alerts
- **LONG Stop/BE/Trail Level Hit** - Long position stopped out
- **SHORT Stop/BE/Trail Level Hit** - Short position stopped out
### How to Set Up Alerts
1. Click "Add Alert" on TradingView
2. Choose this indicator from the dropdown
3. Select desired alert condition
4. Set alert to trigger "Once Per Bar Close"
5. Customize notification method (popup/email/webhook)
---
## 📋 Trading Workflow
### 1. Wait for High-Confidence Signal
Look for the large **HC L** or **HC S** triangle on chart close.
### 2. Verify Confluence
Check the HUD dashboard:
- Confidence score should be 70%+
- HTF status should show alignment
- RSI Zone should be "YES"
### 3. Entry
Enter the trade at market or on next candle open.
### 4. Set Stop Loss
Use the **initial stop** shown in the HUD (red line on chart):
- **Longs**: Below the swing low (10-bar lookback)
- **Shorts**: Above the swing high (10-bar lookback)
### 5. Set Take Profits
- **TP1**: 1R (50% position close) - Yellow line
- **TP2**: 2R (remaining 50% close) - Green line
### 6. Manage the Trade
- Monitor the **R Risk** column to track profit
- Stop moves to break-even automatically after 1R (if enabled)
- ATR trailing stop engages dynamically (red line adjusts)
- Exit if price hits dynamic stop level
---
## 🎨 Visual Guide
### On-Chart Elements
**Triangles**:
- Small lime/red triangles = Base signals (lower confidence)
- Large lime/red triangles = High-confidence signals (trade these!)
**Lines**:
- 🟢 Green line = Fast EMA (20)
- 🟠 Orange line = Slow EMA (50)
- 🔴 Red line = Dynamic stop-loss level
- 🟡 Yellow line = TP1 level
- 🟢 Green line = TP2 (final target)
**HUD Colors**:
- 🟢 Green = Bullish/Active/Good
- 🔴 Red = Bearish/Inactive/Warning
- 🟡 Yellow = Neutral/Caution
- 🔵 Blue = Informational
- ⚫ Gray = Disabled/Off
---
## 💡 Strategy Tips
### Best Practices
1. **Only trade High-Confidence signals** - Ignore base signals unless very experienced
2. **Respect the HTF** - Don't fight the higher timeframe trend
3. **Use proper position sizing** - Risk 1-2% of account per trade
4. **Partial profits work** - Take 50% off at TP1, let rest run to TP2
5. **Let winners run** - Trailing stop helps capture extended moves
6. **Be patient** - Quality over quantity; wait for 70%+ confluence
### Optimal Timeframes
- **Primary Chart**: 1H, 4H, Daily (swing trading)
- **HTF Setting**: One level higher than your chart
- If trading 1H → Set HTF to 4H or D
- If trading 4H → Set HTF to D or W
- If trading Daily → Set HTF to W
### Market Conditions
**Best Performance**:
- Trending markets with healthy pullbacks
- Clear support/resistance zones
- Moderate volatility
**Avoid Trading**:
- Extremely choppy/sideways markets
- Major news events (unless experienced)
- Low confidence scores (<40%)
---
## ⚙️ Advanced Customization
### Aggressive Setup (More Signals)
```
Fast EMA: 12
Slow EMA: 26
RSI Min: 35
RSI Max: 65
Use HTF Confirmation: OFF
Require Volume Spike: OFF
```
### Conservative Setup (Fewer, Higher Quality)
```
Fast EMA: 20
Slow EMA: 50
RSI Min: 45
RSI Max: 55
Use HTF Confirmation: ON
Require Volume Spike: ON
Final TP R: 3.0
```
### Scalping Adaptation (Not Recommended)
```
Fast EMA: 9
Slow EMA: 21
Swing Lookback: 5
TP1 R: 0.5
Final TP R: 1.0
```
---
## ⚠️ Risk Disclaimer
**IMPORTANT**: This indicator is for educational and informational purposes only.
- Past performance does not guarantee future results
- No indicator is 100% accurate
- Always use proper risk management
- Never risk more than you can afford to lose
- Consider using a demo account first
- Seek professional financial advice if needed
Trading involves substantial risk of loss and is not suitable for all investors.
---
## 🔧 Troubleshooting
### "No signals appearing"
- Check if HTF confirmation is enabled but market isn't aligned
- Verify RSI zone isn't too restrictive
- Ensure volume spike isn't filtering out all setups
- Try adjusting EMA lengths for your asset
### "Too many false signals"
- Enable HTF confirmation
- Tighten RSI zone (e.g., 45-55)
- Enable volume spike requirement
- Only trade 70%+ confidence setups
### "Stops too tight/wide"
- Adjust Swing Lookback length
- Modify ATR multiplier for trailing stop
- Consider the asset's volatility
### "Alerts not working"
- Ensure alert is set to "Once Per Bar Close"
- Check indicator is added to the chart
- Verify TradingView notification settings
---
## 📚 Version History
**v1.0 (Current)**
- Initial release
- Multi-timeframe confluence system
- Dynamic risk management
- Real-time HUD dashboard
- Comprehensive alert system
- ATR trailing stops
- Break-even automation
---
## 🤝 Support & Feedback
If you find this indicator helpful:
- ⭐ Star the script on TradingView
- 💬 Share your results and feedback
- 🐛 Report bugs or suggest improvements
- 📖 Share with other traders
---
## 📖 Additional Resources
### Recommended Reading
- "The New Trading for a Living" by Dr. Alexander Elder
- "Swing Trading Using Multiple Timeframes" - Educational articles
- Risk management and position sizing guides
### Learn More About
- Multiple timeframe analysis
- EMA crossover strategies
- RSI divergence and zones
- ATR-based stops
- R-multiple profit management
---
## 📝 License
This indicator is provided as-is for personal trading use.
**Usage Rights**:
- ✅ Use for personal trading
- ✅ Modify for personal use
- ❌ Resell or redistribute
- ❌ Claim as original work
---
## 🎓 Quick Start Checklist
- Add indicator to TradingView chart
- Set your preferred timeframe (1H/4H/Daily)
- Configure HTF setting (one level higher)
- Review default parameters
- Set up entry alerts (HC LONG/SHORT)
- Set up TP and SL alerts
- Test on historical data
- Paper trade first
- Start with small position sizes
- Track your results
---
**Happy Trading! 📊💰**
*Remember: Discipline, patience, and risk management are the keys to long-term success.*

0DTE Credit Spreads Indicator0DTE Credit Spreads Indicator
This indicator is designed to assist 0DTE credit spread traders by providing rule-based PCS (Put Credit Spread) and CCS (Call Credit Spread) signals, dynamic risk levels, and an integrated performance summary — all within a single, cohesive tool.
What the indicator does
The script implements a complete intraday framework tailored specifically to same-day expiration credit spreads, combining market structure, volatility context, and trade management logic into one workflow:
Opening Range logic (15-minute)
A defined opening range is used to establish directional bias. Signals are generated only after the range is confirmed, aligning entries with controlled intraday structure rather than momentum chasing.
Optional Early Entry logic
An optional early-entry mechanism evaluates 30-minute RSI extremes during the opening phase only. This is intentionally constrained to the opening window and designed for early premium capture scenarios common in 0DTE trading.
Volatility-aware credit estimation
Expected credit is derived from current volatility conditions to provide realistic assumptions for backtesting, trade visualization, and partial-profit modeling.
Dynamic risk visualization
Each signal automatically plots:
A horizontal stop-loss level
A take-profit level based on user-selected credit percentage
A dynamic diagonal stop line from entry to end-of-day, modeling time-based risk specific to 0DTE positions
Partial profit and contract modeling
The backtest logic supports closing a user-defined number of contracts at the take-profit level, while allowing remaining contracts to run to end-of-day or stop loss. This mirrors real-world 0DTE trade management practices.
Flexible evaluation modes
Trades can be evaluated using either:
Intraday stop-loss crosses, or
End-of-day outcome logic
allowing users to align results with their execution style.
Backtesting and transparency
The indicator includes a live, on-chart backtest table displaying:
PCS and CCS signal counts
Wins, losses, and win rate
Total P/L (points or dollar-based per contract)
Contract and partial-TP configuration
A non-blocking “Recommended context” note indicating whether the script is running on the preferred symbol and timeframe
Signals and visuals will display on any chart. The recommended context is informational only and does not restrict usage.
Chart presentation
Full visual mode with labels, TP/SL levels, and diagonal risk lines
Clean Chart mode with arrow-only signals and a compact summary table
Automatic object management to prevent chart clutter.
Intended use
This indicator is intended as a decision-support and research tool for experienced traders. It does not place trades, does not guarantee profitability, and should be used alongside proper risk management.

Dragon Smart Timing (Trend Analysis)Introduction Dragon Smart Timing is a comprehensive "Clean Chart" trading system designed for trend followers who prefer a minimalist workspace. Instead of cluttering your chart with multiple moving averages and noisy signals, this indicator consolidates complex market data into a sleek, real-time Neon Dashboard.
The system identifies high-probability Pullback Entries within a strong trend and includes a built-in Trade Management Assistant to help you decide when to Hold, Take Profit, or Stop Loss.
1. 🛠 How It Works (The 4-Pillar Logic) The system scans for a specific "Confluence" of 4 conditions. An "Entry Now" signal is triggered only when ALL of the following are met:
Trend Filter (The Safety Guard): Price must be ABOVE the EMA 200. This ensures you only trade in the direction of the long-term trend, avoiding counter-trend risks.
Momentum Alignment: Short-term trends must be healthy (EMA 21 > EMA 50 > EMA 100).
Smart Pullback (RSI): RSI (14) must dip into the "Golden Zone" (40 - 55) and bounce upward. We buy the dip, not the top.
Volume Confirmation: Validates the move with a Volume Spike (> 1.5x Average Volume).
2. 🤖 Trade Management Assistant Unlike standard indicators that leave you guessing after the entry, Dragon Smart Timing tracks the trade for you:
🐲 Entry Now: Signal to open a long position.
✊ Holding...: The system recognizes an active trade and monitors price action.
💰 Take Profit: Triggered when the price closes below the EMA 21, signaling momentum weakness.
🛑 Stop Loss: Triggered if the price drops 7% below your entry price to protect capital.
3. 🖥 The Neon Dashboard
Trend: Displays "Strong Up", "Aligned", or "Below EMA200".
RSI / Vol: Shows real-time values without clutter.
Action: The most important row. It lights up in Neon Green (Entry), Orange (Take Profit), or Red (Stop Loss).
⚙️ Settings
Trend Filter: Adjustable EMA 200 (Turn it into EMA 89 or 100 depending on your style).
Dashboard: Fully customizable position (Top/Bottom/Center) and size to fit your screen.
Risk Parameters: Adjustable Stop Loss % and Volume Multipliers.
⚠️ Risk Disclaimer
This script is for educational purposes only and does not constitute financial advice. Trading involves a high degree of risk. Past performance is not indicative of future results.

Recovery Adaptive Optimizer [Starbots]Recovery Adaptive Optimizer is a high-performance, on-chart parameter optimization engine designed specifically for the Recovery Adaptive Strategy.
It enables professional traders and quantitative researchers to systematically evaluate thousands of parameter combinations directly within Pine Script, without relying on external tools.
The optimizer performs a full simulation of the strategy logic, replicating adaptive position sizing, dynamic take-profit expansion, and loss-streak behavior with precision.
🧠 Optimization Methodology
The optimizer executes a multi-configuration simulation grid in parallel, where each configuration represents a unique combination of:
Base Take-Profit (%)
Take-Profit Factor
Stop-Loss (%)
Position Size Factor
Volatility Filter (On / Off)
Flat-Market Filter (On / Off)
Trend Filter (On / Off)
Each configuration is evaluated using the same execution logic as the strategy:
Single-position model
Loss-streak-based scaling
Step-capped progression
Bar-confirmed entries and exits
Commission-aware equity accounting
This allows precise comparative analysis across high-volatility market conditions, where parameter sensitivity and expansion behavior are most relevant.
Optional features include:
Higher-timeframe signal evaluation
Volatility-conditioned execution
Flat-market exclusion
EMA trend alignment (manual toggle)
All filters can be evaluated independently across the optimization grid.
📊 Performance Metrics & Ranking
Each configuration is evaluated using multiple institutional-grade metrics:
Net Profit (%)
Maximum Drawdown (%)
Win Rate
Trade Count
Equity Curve Peak-to-Valley 'Drawdown'
Configurations are ranked using a score metric:
Score = Profit % ÷ Max Drawdown %
This allows rapid identification of parameter sets that balance performance efficiency and capital utilization.
🏆 Automated Best-Case Selection
At the end of the historical data window, the optimizer additionally identifies and displays:
🏆 Best Configuration by Net Profit
🛡️ Best Configuration by Lowest Drawdown
🎯 Best Configuration by Win Rate (with optional minimum profitability threshold)
Top-ranked configurations are displayed via ranked comparison table (Top 5 or Top 15 results)
🧩 Intended Use
This optimizer is designed for:
Professional traders
Systematic strategy developers
Quantitative research
Parameter tuning for volatile markets
Strategy calibration across different instruments and timeframes
It provides a structured, transparent environment for identifying robust parameter clusters rather than single isolated results.

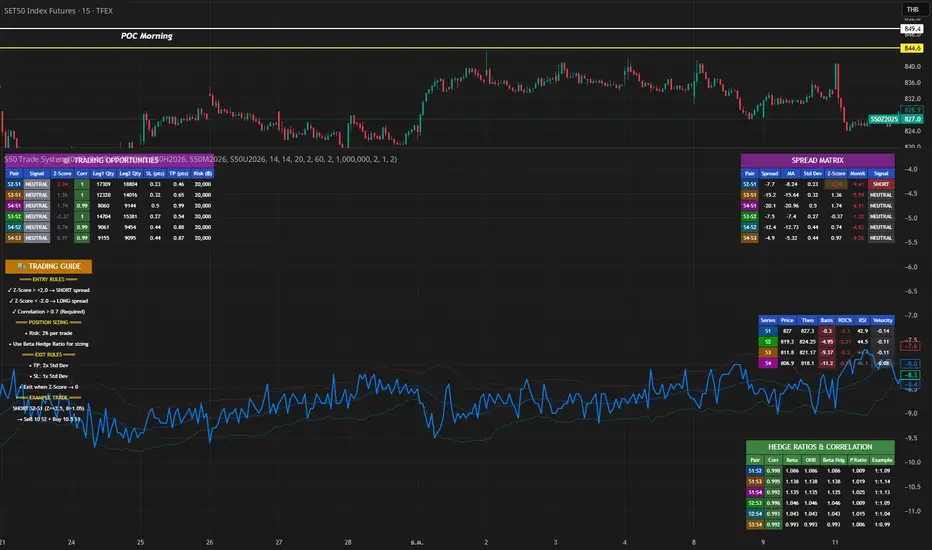
S50 Complete Hedge & Trade SystemTFEX:S501!
คู่มือการเทรด CALENDAR SPREAD
1. กลยุทธ์หลัก: MEAN REVERSION SPREAD TRADING
หลักการ:
- Spread ระหว่าง series จะมีค่าเฉลี่ย (Mean) และแกว่งไปมารอบๆ ค่าเฉลี่ยนี้
- เมื่อ Spread เบี่ยงเบนไปจาก Mean มากเกินไป จะกลับมาหาค่าเฉลี่ย (Mean Reversion)
2. INDICATORS ที่ใช้
A. Z-Score
Z-Score = (Spread ปัจจุบัน - Spread เฉลี่ย) / Standard Deviation
การตีความ:
- Z > +2.0 → Spread แพงเกินไป → SHORT spread
- Z < -2.0 → Spread ถูกเกินไป → LONG spread
- Z ≈ 0 → Spread อยู่ที่ค่าเฉลี่ย → EXIT
B. Correlation
Correlation > 0.9 = ดีมาก (เคลื่อนไหวพร้อมกัน 90%+)
Correlation > 0.7 = ดี (ใช้ได้)
Correlation < 0.7 = ไม่แนะนำ (Hedge ไม่มีประสิทธิภาพ)
C. Beta & Hedge Ratio
Beta = Cov(S1, S2) / Var(S2)→ บอกว่า S1 เคลื่อนไหวเท่าไหร่เมื่อ S2 เคลื่อนไหว 1 หน่วย
Hedge Ratio = Beta→ ใช้คำนวณจำนวน contract ที่ต้อง hedge
3. วิธีการเทรด SPREAD (ทีละขั้นตอน)
STEP 1: หาโอกาส
เงื่อนไข Entry:
1. |Z-Score| >= 2.0
2. Correlation > 0.7
3. Signal = "SHORT SPREAD" หรือ "LONG SPREAD"
STEP 2: คำนวณ Position Size
ตัวอย่าง:
- Account Size = 1,000,000 บาท
- Risk Per Trade = 2% = 20,000 บาท
- Spread Std Dev = 15 จุด
- Stop Loss = 1.0x Std Dev = 15 จุด
- S50 มูลค่า = 5 บาท/จุด
Position Size = Risk Amount / (SL Distance × Point Value)
= 20,000 / (15 × 5)
= 20,000 / 75
= 266 contracts (ปัดเป็น 26 สัญญา)
STEP 3: คำนวณ Hedge Ratio
สมมติ: Beta (S1:S2) = 1.05
ถ้าเทรด SHORT S2-S1 spread:
- Sell S2: 26 contracts
- Buy S1: 26 × 1.05 = 27.3 → ปัดเป็น 27 contracts
Portfolio Delta ≈ 0 (Market Neutral)
4. ตัวอย่างการเทรดจริง
SCENARIO A: SHORT SPREAD (Z-Score = +2.5)
สถานการณ์:
- S2-S1 Spread = 50 จุด
- Spread MA = 35 จุด
- Spread Std Dev = 6 จุด
- Z-Score = (50-35)/6 = +2.5 ⚠️ แพงเกินไป
- Correlation = 0.92 ✅
- Beta = 1.05
TRADE PLAN:
1. SELL S2: 10 contracts @ 1,200
2. BUY S1: 10 × 1.05 = 10.5 → 11 contracts @ 1,150
Initial Spread = 50 จุด
Take Profit (TP):
- Target Spread = MA = 35 จุด
- TP Distance = 50 - 35 = 15 จุด
- Profit = 15 × 5 = 75 บาท/spread
- Total Profit = 75 × 10 = 750 บาท
Stop Loss (SL):
- SL Spread = MA + (1.5 × Std Dev) = 35 + 9 = 44 จุด
- SL Distance = 50 - 44 = 6 จุด (ผิดพลาด - ควรเป็น 50 + 6 = 56)
- Loss = 6 × 5 × 10 = 300 บาท
Risk:Reward = 300:750 = 1:2.5
SCENARIO B: LONG SPREAD (Z-Score = -2.3)
สถานการณ์:
- S3-S2 Spread = 20 จุด
- Spread MA = 35 จุด
- Spread Std Dev = 6.5 จุด
- Z-Score = (20-35)/6.5 = -2.3 ⚠️ ถูกเกินไป
- Correlation = 0.88 ✅
- Beta = 1.03
TRADE PLAN:
1. BUY S3: 10 contracts @ 1,230
2. SELL S2: 10 × 1.03 = 10.3 → 10 contracts @ 1,210
Initial Spread = 20 จุด
Take Profit:
- Target Spread = 35 จุด
- Profit = (35-20) × 5 × 10 = 750 บาท
Stop Loss:
- SL Spread = MA - (1.5 × Std Dev) = 35 - 9.75 = 25.25 จุด
- SL = 20 - (20-25.25) = 14 จุด
- Loss = 6 × 5 × 10 = 300 บาท
5. RISK MANAGEMENT
A. Position Sizing Rules
1. อย่าเสี่ยงเกิน 2-3% ต่อการเทรด
2. ใช้ Beta Hedge Ratio เสมอ
3. ตรวจสอบ Margin requirement
B. Stop Loss Strategy
วิธีที่ 1: Fixed Std Dev
- SL = Entry ± (1.0-1.5x Std Dev)
วิธีที่ 2: ATR-based
- SL = Entry ± (1.5x ATR)
วิธีที่ 3: Time-based
- ปิดภายใน 3-5 วัน ถ้าไม่ได้กำไร
C. Take Profit Strategy
วิธีที่ 1: Target MA
- TP เมื่อ Spread กลับมาที่ MA
วิธีที่ 2: Partial Profit
- ปิด 50% เมื่อได้ 1x Std Dev
- ปิดอีก 50% เมื่อ Z-Score = 0
วิธีที่ 3: Trailing Stop
- Trailing SL = 0.5x Std Dev
6. สูตรคำนวณสำคัญ
1. Position Size
position_size = (account_size × risk_pct) / (sl_distance × point_value)
2. Hedge Contracts
hedge_contracts = position_size × beta
3. Profit/Loss Calculation
pnl = (exit_spread - entry_spread) × contracts × point_value
4. Risk:Reward Ratio
risk = sl_distance × contracts × point_value
reward = tp_distance × contracts × point_value
rr_ratio = reward / risk // ควร >= 2:1
5. Spread Value
spread_value = price_far - price_near
7. CHECKLIST ก่อนเทรด
☐ Z-Score >= ±2.0
☐ Correlation > 0.7
☐ Beta Hedge Ratio คำนวณแล้ว
☐ Position Size ไม่เกิน 2-3% risk
☐ TP/SL กำหนดชัดเจน
☐ Risk:Reward >= 2:1
☐ Margin เพียงพอ
☐ ตรวจสอบ Expiry Date ทั้ง 2 series
8. เทคนิคขั้นสูง
A. Calendar Roll Strategy
เมื่อ Near series ใกล้หมดอายุ:
1. ปิด Near leg
2. เปิด Next series leg ใหม่
3. รักษา Spread position ต่อไป
B. Butterfly Spread
ใช้ 3 series พร้อมกัน:
- Buy S1
- Sell 2×S2
- Buy S3
เหมาะกับตลาดไซด์เวย์
C. Dynamic Hedging
ปรับ Hedge Ratio ตาม:
- Beta ที่เปลี่ยนแปลง
- Volatility
- Time to Expiry
able FRVP Reversal# able FRVP Reversal - Complete User Guide
## 📌 Overview
**able FRVP Reversal** is a professional-grade Volume Profile indicator with an integrated reversal detection system. It combines Fixed Range Volume Profile (FRVP) analysis with a confluence-based reversal scoring system to identify high-probability turning points at key volume levels.
---
## ✨ Key Features
| Feature | Description |
|---------|-------------|
| **Session-Based Volume Profile** | Automatically resets at the beginning of each regular trading session |
| **POC (Point of Control)** | Highest volume price level - strongest support/resistance |
| **VAH (Value Area High)** | Upper boundary of the 70% value area - resistance zone |
| **VAL (Value Area Low)** | Lower boundary of the 70% value area - support zone |
| **Confluence Scoring System** | 5-point scoring system for reversal detection |
| **Smart Cooldown** | Prevents signal spam with customizable cooldown period |
| **Real-time Info Table** | Displays all key metrics in a retro-style dashboard |
---
## 🔧 Installation
1. Open TradingView and go to **Pine Editor**
2. Delete any existing code and paste the indicator code
3. Click **"Add to Chart"**
4. Configure settings as needed
---
## ⚙️ Settings Explained
### 📊 Volume Profile Settings
| Setting | Default | Description |
|---------|---------|-------------|
| **Number of Rows** | 50 | Resolution of the volume profile (more rows = finer detail) |
| **Value Area %** | 70 | Percentage of volume to include in Value Area (industry standard: 70%) |
| **Profile Width** | 40 | Visual width of the histogram on chart |
| **Show Histogram** | ✓ | Display volume histogram bars |
| **Show POC/VAH/VAL** | ✓ | Display the three key levels |
| **Show Labels** | ✓ | Display price labels for each level |
| **Extend Lines** | ✓ | Extend levels to the right of current price |
| **Extend Length** | 100 | How far to extend the lines (in bars) |
### 🔄 Reversal Detection Settings
| Setting | Default | Description |
|---------|---------|-------------|
| **Enable Reversal Detection** | ✓ | Turn reversal signals on/off |
| **Min Confluence Score** | 3 | Minimum score required to trigger signal (1-5) |
| **Cooldown Bars** | 10 | Minimum bars between signals to prevent spam |
#### Understanding Min Confluence Score:
- **Score 1-2**: Very sensitive, many signals (not recommended)
- **Score 3**: Balanced - good for most traders ⭐ Recommended
- **Score 4**: Conservative - fewer but higher quality signals
- **Score 5**: Very strict - only strongest reversals
### 🎨 Color Settings
All colors are fully customizable:
- **POC Line**: Default Gold (#FFD700)
- **VAH Line**: Default Coral Red (#FF6B6B)
- **VAL Line**: Default Teal (#4ECDC4)
- **Bullish Reversal**: Default Green (#00E676)
- **Bearish Reversal**: Default Red (#FF5252)
---
## 📖 How to Read the Indicator
### Volume Profile Histogram
```
█████████████ ← High volume = Strong S/R
████████ ← Medium volume
████ ← Low volume = Weak S/R
██
```
- **Darker/Longer bars** = More trading activity at that price
- **Inside Value Area** = Colored based on session direction (Bull/Bear)
- **Outside Value Area** = Muted gray color
### Key Levels
| Level | Color | Meaning |
|-------|-------|---------|
| **POC** | Yellow | Price with highest volume - Strongest magnet |
| **VAH** | Red | Upper resistance - Look for bearish reversals |
| **VAL** | Teal | Lower support - Look for bullish reversals |
---
## 🔄 Reversal Detection System
### How the Scoring System Works
The indicator uses a **5-point confluence scoring system**. Each condition adds 1 point:
#### 🟢 Bullish Reversal Score (at VAL)
| Condition | Points | Description |
|-----------|--------|-------------|
| Price at VAL Zone | +1 | Price is within VAL ± 0.2 ATR |
| Bullish Candle | +1 | Close > Open (green candle) |
| RSI Oversold | +1 | RSI < 35 |
| Rejection Wick | +1 | Lower wick > 1.5× body size |
| Failed Breakdown | +1 | Touched below VAL but closed above |
#### 🔴 Bearish Reversal Score (at VAH)
| Condition | Points | Description |
|-----------|--------|-------------|
| Price at VAH Zone | +1 | Price is within VAH ± 0.2 ATR |
| Bearish Candle | +1 | Close < Open (red candle) |
| RSI Overbought | +1 | RSI > 65 |
| Rejection Wick | +1 | Upper wick > 1.5× body size |
| Failed Breakout | +1 | Touched above VAH but closed below |
### Signal Quality Ratings
| Score | Rating | Meaning |
|-------|--------|---------|
| 5/5 | ★★★ | Excellent - Highest probability |
| 4/5 | ★★ | Good - High probability |
| 3/5 | ★ | Acceptable - Moderate probability |
| <3 | - | No signal triggered |
---
## 📋 Info Table Explained
```
╔═ able-REV ═╗ 15 ████████ SCR
─────────────────────────────────────
ZONE UPPER VA ▒▒▓▓████ ▲
POC 4272.680 ██████·· ▲
VAH 4322.745 ████···· ·
VAL 4264.977 ██████·· ·
═ SCORE ═════════════════════════════
BULL 0/5 ········ ·
BEAR 1/5 ░······· ·
RSI 49 ▒▒▓▓···· ·
◄SIGNAL► WAIT ········ ·
```
| Row | Description |
|-----|-------------|
| **ZONE** | Current price position relative to Value Area |
| **POC/VAH/VAL** | Price levels with distance indicators |
| **BULL Score** | Current bullish confluence score |
| **BEAR Score** | Current bearish confluence score |
| **RSI** | RSI value with OB/OS status |
| **SIGNAL** | Current signal status (BUY/SELL/WAIT) |
### Zone Types
| Zone | Meaning | Bias |
|------|---------|------|
| ABOVE VAH | Price broke above resistance | Bullish (but watch for rejection) |
| ⚠ AT VAH | Price testing resistance | Watch for bearish reversal |
| UPPER VA | Price in upper value area | Slight bullish bias |
| LOWER VA | Price in lower value area | Slight bearish bias |
| ⚠ AT VAL | Price testing support | Watch for bullish reversal |
| BELOW VAL | Price broke below support | Bearish (but watch for rejection) |
---
## 📈 Trading Strategies
### Strategy 1: VAH Rejection (Bearish Reversal)
**Setup:**
1. Price approaches or touches VAH (red dashed line)
2. BEAR score reaches 3+ (or your minimum setting)
3. REV signal appears above the candle
**Entry:**
- Enter SHORT on signal candle close
- Or wait for confirmation candle
**Stop Loss:**
- Above the signal candle high
- Or above VAH + 0.5 ATR
**Take Profit:**
- First target: POC (yellow line)
- Second target: VAL (teal line)
---
### Strategy 2: VAL Bounce (Bullish Reversal)
**Setup:**
1. Price approaches or touches VAL (teal dashed line)
2. BULL score reaches 3+ (or your minimum setting)
3. REV signal appears below the candle
**Entry:**
- Enter LONG on signal candle close
- Or wait for confirmation candle
**Stop Loss:**
- Below the signal candle low
- Or below VAL - 0.5 ATR
**Take Profit:**
- First target: POC (yellow line)
- Second target: VAH (red line)
---
### Strategy 3: POC Bounce
**Setup:**
1. Price pulls back to POC after trending
2. POC acts as support/resistance
3. Watch for reversal candle patterns
**Entry:**
- Long if bullish candle at POC from below
- Short if bearish candle at POC from above
**Stop Loss:**
- Other side of POC ± buffer
---
## ⚠️ Important Notes
### When Signals Work Best
✅ **High Probability Setups:**
- Score 4-5 with clear rejection wick
- RSI confirms (oversold for long, overbought for short)
- First test of VAH/VAL in the session
- Clear trend before reversal
❌ **Low Probability Setups:**
- Score barely meeting minimum (3/5)
- Multiple tests of same level (level weakening)
- Low volume/choppy market
- News events pending
### Risk Management Rules
1. **Never risk more than 1-2% per trade**
2. **Always use stop loss** - place beyond the level
3. **Wait for candle close** - don't enter on wick touches
4. **Respect the cooldown** - avoid overtrading
5. **Consider the trend** - counter-trend reversals are riskier
---
## 🔔 Alerts
The indicator includes built-in alerts:
| Alert | Trigger |
|-------|---------|
| VAL Bullish Reversal | BULL score meets minimum at VAL |
| VAH Bearish Reversal | BEAR score meets minimum at VAH |
### Setting Up Alerts:
1. Right-click on the chart
2. Select "Add Alert"
3. Choose "able FRVP Reversal" as condition
4. Select desired alert type
5. Configure notification method
---
## 💡 Pro Tips
1. **Combine with trend analysis** - Reversals in trend direction are more reliable
2. **Watch for confluence with other S/R** - If VAH/VAL aligns with round numbers, previous highs/lows, or fib levels, the level is stronger
3. **Volume confirmation** - Higher volume on reversal candle = stronger signal
4. **Time of day matters** - Reversals during active trading hours are more reliable
5. **Adjust sensitivity by market** - Volatile assets may need higher Min Confluence Score
6. **Use multiple timeframes** - Check if reversal level aligns with higher timeframe levels
---
## 🔧 Recommended Settings by Trading Style
| Style | Min Confluence | Cooldown | Best For |
|-------|----------------|----------|----------|
| Scalping | 3 | 5-7 | Quick trades, more signals |
| Day Trading | 3-4 | 10-15 | Balanced approach |
| Swing Trading | 4-5 | 20+ | Fewer, higher quality signals |
---
## ❓ Troubleshooting
| Issue | Solution |
|-------|----------|
| No signals appearing | Lower Min Confluence Score or check if market is ranging |
| Too many signals | Increase Min Confluence Score or Cooldown Bars |
| Levels not showing | Enable Show POC/VAH/VAL in settings |
| Histogram too wide/narrow | Adjust Profile Width setting |
---
## 📞 Support
For questions, suggestions, or bug reports, please contact the developer.
---
**Version:** 1.0
**Last Updated:** 2024
**Platform:** TradingView (Pine Script v6)

MeanReversion_tradeALERTOverview The Apex Reversal Predictor v2.5 is a specialized mean reversion strategy designed for scalping high-volatility assets like NQ (Nasdaq), ES (S&P 500), and Crypto. While most indicators chase breakouts, this system hunts for "Liquidity Sweeps"—moments where the market briefly breaks a key level to trap retail traders before snapping back to the true value (VWAP).
This is not just a signal indicator; it is a full Trade Manager that calculates your Entry, Stop Loss, and Take Profit levels automatically based on volatility (ATR).
The Logic: Why This Works Markets act like a rubber band. They can only stretch so far from their average price before snapping back. This script combines three layers of logic to identify these snap-back points:
The Stretch (Sigma Score): Measures how far price is from the VWAP relative to ATR. If the score > 2.0, the "rubber band" is overextended.
The Trap (Liquidity Sweep): Identifies Pivot Highs/Lows. It waits for price to break a pivot (luring in breakout traders) and then immediately reverse (trapping them).
The Exhaustion (RSI): Confirms that momentum is Overbought/Oversold to prevent trading against a strong trend.
Key Features
Dynamic Lines: Automatically draws Blue (Entry), Red (SL), and Green (TP) lines on the chart for active trades.
Smart Targets: Two modes for taking profit:
Mean Reversion: Targets the VWAP line (High Win Rate).
Fixed Ratio: Targets a specific Risk:Reward (e.g., 1:2).
Live Dashboard: Tracks Win Rate, Net Points, and the live "Stretch Score" in the bottom right corner.
Alert Ready: Formatted JSON alerts for easy integration with Discord or trading bots.
How & When to Use (User Guide)
1. Best Timeframes
5-Minute (5m): Best for NQ and volatile stocks (TSLA, NVDA). Filters out 1-minute noise but catches the intraday reversals.
15-Minute (15m): Best for Forex or slower-moving indices (ES).
2. The Setup Checklist Before taking a trade, look at the Dashboard in the bottom right:
Step 1: Check the "Stretch (Sigma)". Is it Orange or Red? This means price is extended and ripe for a reversal. If it's Green, the market is calm—be careful.
Step 2: Wait for the Signal.
"Apex BUY" (Green Label): Price swept a low and closed green.
"Apex SELL" (Red Label): Price swept a high and closed red.
Step 3: Execute. Enter at the close of the signal candle. Set your stop loss at the Red Line provided by the script.
3. Warning / When NOT to Use
Strong Trending Days: If the market is trending heavily (e.g., creating higher highs all day without looking back), do not fight the trend.
News Events: Avoid using this during CPI, FOMC, or NFP releases. The "rubber band" logic breaks during news because volatility expands indefinitely.

XΩ — Trade Commander (Global)1. What is XΩ — Trade Commander?
XΩ — Trade Commander (Global) is a post‑entry position management system.
It does not tell you where to enter. Instead, it helps you manage a trade after you are already in:
Dynamic Trailing Stop based on volatility (ATR)
Visual Safe Zone under price
R‑Multiple targets (1R, 2R, 3R) for profit‑taking
A live Position Dashboard with PnL and suggested actions
Exit alert when price breaks the Trailing Stop
Plus a ZERO GENESIS brand signature on the chart
Think of it as a trade commander / position guardian that enforces your risk and trailing rules.
2. Basic setup (Inputs)
In the Active Position Settings group:
Position Active?
Turn ON when you have a live position you want to manage.
Turn OFF when flat (no position), to effectively disable the management logic.
Avg Entry Price
Enter your average entry price (if you scaled in, use your weighted average).
This is the reference for all PnL and R calculations.
Initial Stop Loss
Your original invalidation price (hard stop) when you planned the trade.
Used to define:
The size of 1R (initial risk unit)
The locations of 1R, 2R, 3R targets.
Position Size (Units)
Size of your current position (number of shares/coins/contracts, etc.).
Used to convert PnL into currency value.
In the Trailing Stop Engine group:
Trailing Width (xATR)
Controls how tight/loose the trailing stop is:
Smaller value → tighter, closer to price (protects faster, more likely to get stopped out early)
Larger value → looser, farther from price (lets winners run, accepts more swing)
Source
Price source for the trailing engine:
AVA → smoothed price (reduces noise and “random” stop‑outs)
Close → closing price
High/Low → mid of high & low
In the Take Profit Targets (R-Multiples) group:
Show R-Levels
Turn ON to draw 1R, 2R, 3R reference lines on the chart.
Turn OFF if you prefer a cleaner chart.
3. How to read the indicator on the chart
Once Position Active? is ON and you’ve filled Avg Entry Price / Initial Stop Loss / Position Size, you’ll see:
3.1. Trailing Stop line (“The Shield”)
A blue/gray line below price (for long trades):
It only moves up, never down (ratchet‑style trailing).
When price rises → the trailing stop is adjusted upward.
When price falls → the trailing stop stays in place, not lowered.
Color:
Blue → price is still above the trailing stop (protected, trade is “alive”).
Gray → price is below the trailing stop (trailing has been violated).
Visually, this line is your dynamic protective shield.
3.2. Safe Zone (blue fill)
Light blue fill between price (chosen source) and the Trailing Stop line.
Represents your current buffer:
Thick Safe Zone → good distance to the stop → room for normal volatility.
Thin Safe Zone → close to stop → trade is at risk of being closed.
3.3. Entry & Hard Stop lines
Horizontal lines:
Entry Price → gray dotted line
Initial Stop Loss → solid red line
Helps you always see:
Where the trade started
Where the original invalidation was (your planned “I’m wrong here” level)
3.4. R‑Multiple Targets (1R, 2R, 3R)
When Show R-Levels is ON and Initial Stop Loss is set:
1R: dashed green line, labeled 1R
2R: dashed green line, labeled 2R
3R: dashed green line, labeled 3R (Target)
Use these for:
Planning partial take‑profits
Knowing when it’s reasonable to move your stop (e.g., to breakeven at 1R)
Evaluating your trade in terms of reward vs initial risk
3.5. “POSITION GUARDIAN” Dashboard label
Near the current price, you’ll see a label like:
Title: 🛡️ POSITION GUARDIAN
Inside:
Size: your position size and entry price
PnL: current profit/loss percentage and value (auto‑formatted, e.g. 1.23M, 45K, etc.)
R-Multiple: your current R (e.g., 0.7R, 1.5R, 3.2R)
TRAILING STOP: the current trailing stop price
ACTION: a suggested action string, for example:
🚫 TRAILING HIT -> EXIT NOW!
🚀 RUNNING PROFIT (x.xR) -> Hold or Trim
✅ IN PROFIT (x.xR) -> Move SL to BE
⚠️ DRAWDOWN -> Watch Trailing Stop
🟢 BREAKEVEN -> Holding
The text color changes (red, green, yellow, orange, etc.) to match the situation, so you can read your trade status at a glance.
4. How to use it in practice
Step 1 – Right after entering a trade
Open a position using your own entry strategy (Commander does not give entries).
On the TradingView chart:
Set Position Active? = true
Fill:
Avg Entry Price = your actual entry
Initial Stop Loss = your planned hard stop
Position Size = the size of your position
Adjust:
Trailing Width (xATR):
Lower for tight, short‑term trades (scalp/intraday).
Higher for swing/position trades to avoid premature exits.
Turn Show R-Levels ON if you trade in terms of R.
Now the script will start drawing the Trailing Stop, Safe Zone, R levels, and Dashboard.
Step 2 – While the trade is running
When price moves in your favor:
Track:
Your current R-Multiple
How much Safe Zone you have
Typical logic:
Once you reach ≥ 1R, consider moving your hard stop to breakeven (BE).
Around 2R–3R, consider:
Taking partial profits
Tightening the trailing
Letting the remainder run with the Shield.
When price pulls back:
If price breaks below the Trailing Stop:
Dashboard shows the red warning: TRAILING HIT -> EXIT NOW!
The alert (if enabled) will also fire.
→ This is your disciplined exit condition according to Commander.
When price hovers near entry:
Dashboard shows BREAKEVEN or DRAWDOWN.
You can:
Give the setup more time
Or decide to scratch the trade if it no longer fits your plan
(The key is: you’re deciding based on a clear snapshot, not pure emotion.)
5. Alerts
The script contains one key alert:
XΩ EXIT SIGNAL
Triggers when price crosses under the Trailing Stop.
Message: "Price breached Trailing Stop. Exit position immediately!"
Use this alert to automate your exit discipline: you don’t need to stare at the chart to know when your trailing stop is hit.

Risk Management Console Pro by ShogunRisk Management Console Pro - Professional Trading Analytics
⚠️ CRITICAL LIQUIDATION DISCLAIMER ⚠️
The liquidation price calculated by this indicator is an approximation based on MEXC perpetual futures methodology and serves as a guide only. This level represents a catastrophic threshold and should never be approached in live trading. Actual liquidation prices vary by exchange, position size, market conditions, and fee structures. It is the trader's sole responsibility to diligently monitor risk exposure, maintain adequate margin buffers, and manage positions appropriately. This tool does not replace proper risk management protocols or real-time exchange data.
---
Overview
The Risk Management Console Pro is institutional-grade risk architecture I've built for futures traders who need precision capital deployment and surgical risk management. After a decade working across institutional finance and fintech, I developed this tool to bridge the gap between professional trading desks and retail execution.
Core Functionality
When you load the indicator, it prompts you to set three critical price anchors using a simple drag-and-drop interface: Entry Price, Stop Loss, and Take Profit. The system calculates an approximate liquidation threshold using MEXC perpetual futures methodology, so you can visualize your catastrophic risk boundary. All levels appear as horizontal reference lines with visual labels - a much cleaner approach than standard long/short tools.
The console automatically detects whether you're going long or short based on where your entry sits relative to your take profit. No manual configuration needed. The liquidation calculations adapt correctly for both directions.
Capital Allocation Framework
You configure two key parameters:
- Maintenance Margin (default $1,000 USD) - the collateral required to open and maintain your leveraged position
- Leverage (default 50x) - your position multiplier that determines capital efficiency and risk exposure
These inputs drive all the real-time calculations, letting you model position sizing with institutional precision before you commit capital.
Dashboard Analytics
The on-chart console displays comprehensive trade metrics in a clean, modern interface built for quick decision-making:
- Position Architecture: Margin, Leverage, Position Size, Quantity
- Risk/Reward Ratio: Real-time R:R calculation showing your trade asymmetry
- Price Levels: Entry, Stop Loss, Take Profit, Liquidation (color-coded as blue/red/green/orange)
- Live Performance: Unrealized P/L updating tick-by-tick with percentage of margin exposure (green for profit, red for loss)
- Projected Outcomes: Maximum loss and profit potential with margin-relative percentages
Display Customization
You have full control over visual elements through Display Settings:
- Toggle horizontal price lines
- Show/hide price level labels
- Toggle dashboard visibility
- Adjust table position (6 locations available)
- Modify color scheme (title, data, text, accent colors)
Professional Design
I went with an institutional dark theme using a slate/charcoal palette. The interface delivers Wall Street-caliber aesthetics with functional clarity. Every element is built for traders operating in high-stakes environments where milliseconds and basis points matter. The dashboard footer carries the Kaizen Systems signature, representing our commitment to continuous improvement in trading methodology.
Key Features Summary
- Automatic long/short detection
- MEXC-based liquidation calculation
- Real-time unrealized P/L tracking
- Draggable price level inputs
- Color-coded risk visualization
- Institutional-grade interface
- Fully customizable display options
- Position size optimization
- R:R ratio analysis
Risk Management Philosophy
This tool embodies a principle I've learned over the years: professional traders quantify risk before entering positions. By visualizing entry, exit, and catastrophic thresholds simultaneously, the Risk Management Console Pro enforces disciplined capital allocation and eliminates emotional decision-making during live market conditions.
Intended Use
I designed this for futures traders using leverage on perpetual contracts, particularly those trading on MEXC or similar platforms. It's ideal for intraday scalpers, swing traders, and position traders who need precise risk calculations across varying timeframes. The console transforms abstract concepts like "position sizing" and "risk/reward" into tangible, actionable data.
About Me
I'm Shogun, and I've spent the last decade deep in quantitative analysis, algorithmic strategy development, and institutional trading operations. As Founding Director of Kaizen Systems - a fintech platform I built to democratize institutional-grade tools for retail traders - I've created multiple proprietary indicators including the Katana strategy series. My focus is translating complex quantitative frameworks into accessible, actionable tools that empower traders at every level to execute with professional discipline.
The Risk Management Console Pro represents my commitment to elevating retail trading standards by providing the same caliber of risk analytics used by professional trading desks. Through continuous refinement and trader feedback, Kaizen Systems delivers tools that merge technical sophistication with practical usability.
Technical Notes
- Compatible with all timeframes and instruments
- Lightweight execution with minimal CPU overhead
- Updates in real-time on every tick
- No repainting or future data leakage
- Pure Pine Script v5 implementation
Support and Updates
For questions, feature requests, or trading strategy consultation, connect with me through TradingView messaging or visit Kaizen Systems for comprehensive trading resources and community support.
---
© 2025 Shogun for Kaizen Systems | All Rights Reserved
Trade responsibly. Past performance does not guarantee future results. Leverage amplifies both gains and losses.

Book of Fish: Universal Deep DiveAhoy, Captain. 🏴☠️
Here is your official Angler’s Manual for the Book of Fish: Universal Deep Dive. This guide translates every pixel on your TradingView chart into nautical instruction so you can navigate the currents and land the big catch.
Print this out, tape it to your monitor, and respect the code of the sea.
________________________________________
📖 The Angler’s Manual: How to Fish
A Guide to the "Universal Deep Dive" Indicator
🌊 1. Check the Current (Background Color)
Before you cast a line, you must know which way the river is flowing.
• Green Water (Background): The tide is coming in. The broad market (Advancers) is beating the losers.
o The Rule: We prefer Longs (Calls). Swimming upstream against the green current is dangerous.
• Red Water (Background): The tide is going out. The market is heavy.
o The Rule: We prefer Shorts (Puts). Don't fight the gravity.
Captain’s Note: If your specific fish (stock) is Green while the water is Red, that’s a Monster Fish (Relative Strength). It’s strong, but keep a tight drag—if it gets tired, the current will drag it down fast.
________________________________________
🐟 2. Identify the Species (Candle Colors)
The color of your bars tells you exactly what strategy to deploy.
🟢 The Marlin (Ultra Bull)
• Visual: Green Candles. Price is riding above the Yellow Wave (20 EMA), and the Yellow Wave is above the White Whale (200 EMA).
• Strategy: Trend Following.
• How to Fish:
o Wait for the fish to swim down and touch the Yellow Wave.
o If it bounces? CAST! (Enter Long).
o Target: Let it run until the trend bends.
🔴 The Barracuda (Ultra Bear)
• Visual: Red Candles. Price is diving below the Yellow Wave, and the Yellow Wave is below the White Whale.
• Strategy: Trend Following (Short).
• How to Fish:
o Wait for the fish to jump up and hit the Yellow Wave.
o If it rejects? CAST! (Enter Short).
🟠 The Bottom Feeder (No Man’s Zone)
• Visual: Orange or Lime Candles. The price is fighting the trend (e.g., Price is below Yellow, but Yellow is still above White).
• Strategy: Reversion to Mean (Scalping).
• How to Fish:
o You are catching small fry here.
o Target: The Purple Anchor (VWAP) or the White Whale (200 EMA).
o Rule: As soon as it hits the Anchor or the Whale, cut the line and take your profit. Do not hold for a home run.
________________________________________
🎣 3. The Tackle Box (Signals & Icons)
These shapes are your triggers. They tell you when to strike.
Icon Name Meaning Action
▲ (Green Triangle) 3-Bar Play THE STRIKE. Momentum is breaking out after a rest. ENTER NOW. This is the sharpest hook in the box. Trend is resuming.
🔷 (Blue Diamond) Inside Bar The Nibble. Price is coiling/resting. Set a trap. Place a stop-entry slightly above the diamond (for longs).
⚫ (Black Dots) The Squeeze Calm Waters. Volatility has died. DO NOT CAST. Wait. When the dots disappear, the storm (and the move) begins.
9️⃣ (Red/Green Number) Exhaustion Full Net. The school has swum too far in one direction. Take Profits. A Red 9 at the top means the bull run is tired. A Green 9 at the bottom means the bear dive is ending.
✖️ (Purple Cross) RSI Snag Hazard. The engine is overheated (Overbought/Oversold). Don't add weight. The line might snap if you buy here.
________________________________________
🗺️ 4. The Map (The Lines)
• The Yellow Wave (20 EMA): Your surfboard. In a strong trend, price should surf this line. If it closes below it, the surf is over.
• The White Whale (200 EMA): The deep ocean trend. This is massive support/resistance. We generally do not short above the Whale or long below it.
• The Purple Anchor (VWAP): The average price. Prices love to return here when they get lost in the No Man's Zone.
• The Dotted Lines (PDH/PDL): The Horizon. Previous Day High (Green) and Low (Red). Crossing these means you are entering open ocean (Discovery Mode).
⚓ The Captain's Code
1.Don't force the fish. If the chart is chopping (Gray candles), stay on the dock.
2.Respect the '9'. When you see that number, lock in some gains.
3.The Trend is your Friend. Green Candles + Green Background = Smooth Sailing.
Fair winds and following seas.

Momentum Breakout Pro (Zeiierman)█ Overview
Momentum Breakout Pro (Zeiierman) is a breakout-focused quantitative system engineered to identify only the strongest momentum expansions in the market. Instead of reacting to price movement, it reconstructs a refined momentum signal, evaluates its strength and persistence, and validates each breakout against the broader market context. Only when momentum pressure aligns with structural direction, trend state, candle behavior, and spacing requirements will a breakout be considered qualified.
The result is a clean and context-aware signal flow that removes noise and highlights only the breakouts with the highest probability of continuation. Traders receive precise Break signals at qualified points, adaptive trend lines, candle-based trend visualization, structure levels, and volatility-driven confirmation markers. Internally, the system operates as a layered confirmation model designed to enforce directional consensus and filter out the shallow or unreliable moves that typically weaken breakout strategies.
In short, Momentum Breakout Pro offers a refined breakout selection system that focuses on quality over quantity, designed for traders who want clean and well-supported breakout signals backed by structured technical logic.
⚪ Why This One Is Unique
Momentum Breakout Pro’s uniqueness comes from its multi-layered confirmation process. The internal momentum reconstruction ensures that only sustained directional pressure is considered meaningful. Optional filters such as Dynamic Trend, SuperTrend, Average Trend, VWAP, and Market Structure provide an adjustable decision stack, allowing traders to decide how strict or flexible the validation should be. Breakouts are released only when the enabled components agree.
█ Main Features
⚪ Breakout Signals
The Breakout Signals are the core feature of the indicator. They help traders identify high probability breakouts that are more likely to follow through. With built-in confirmation levels, it becomes much easier to judge whether a breakout is strong or likely to fail. Combined with the suggested take profit points, traders can quickly find confirmed breakout opportunities with realistic first profit targets.
⚪ Breakout Filters
The indicator includes multiple filters that align each breakout with the current trend, structure, and momentum. This is essential for identifying only the strongest and most reliable breakout setups.
⚪ Dynamic Trend
The Dynamic Trend is a volatility-aware long-term trend filter. It removes noise and adapts to sharp volatility swings, staying focused on the true underlying trend direction. This helps traders avoid false signals and remain aligned with the broader market drift.
⚪ Moving Average
A standard moving average with a user-defined length. Simple, effective, and easy to understand. It acts as a clean trend filter for both beginners and advanced traders.
⚪ Super Trend
A Super Trend filter that restricts breakout signals to appear only in the direction of the active SuperTrend. This adds an additional layer of directional confirmation.
⚪ VWAP
VWAP (Volume Weighted Average Price) is a powerful anchor, especially on lower timeframes. It serves as a dynamic support or resistance level and a highly reliable trend filter.
⚪ Candle Coloring
The candle coloring engine tracks how long the price has moved in one direction and translates that persistence into a graded bull, mid, or bear color spectrum. This helps traders quickly understand trend strength, confirm momentum, and allow the market enough space to move before a larger breakout occurs.
⚪ Momentum
The momentum filter identifies bursts of momentum and highlights the strongest correlations between price and movement strength. It filters out weak breakouts that are not backed by real momentum, improving accuracy significantly.
⚪ Market Structure
Trading with the current market structure is crucial. This filter ensures that breakout signals appear only when they align with the existing structure, helping traders stay on the right side of the market.
█ How to Use
⚪ Breakouts
Use this tool to identify high-quality breakouts. To increase accuracy, combine the breakout signals with the trend, structure, and momentum filters. When these elements align, the probability of a successful breakout increases significantly.
⚪ Confirmation Levels
The indicator includes three confirmation levels that adapt based on current market volatility.
These levels help you judge the strength of the breakout:
When the three levels are tight and close to the price, it indicates strong conditions. Price is more likely to break through all levels quickly and confirm the breakout.
When the levels are spread out and far from the price, the breakout becomes weaker. Price must travel too far to confirm the move, which lowers the probability of a clean follow-through.
What you want to see is a breakout where all three confirmation levels are penetrated within the next few candles. That is the ideal scenario, indicating a confirmed breakout with a higher chance of continuation in that direction.
⚪ Take Profit Strategy
The indicator includes built-in take profit levels, which act as your first two targets after a confirmed breakout:
Once Take Profit 1 is hit, move your stop loss to break even.
When Take Profit 2 is hit, move your stop loss to the first take profit level.
From there, allow the position to run until the candle coloring shifts, signaling that momentum may be slowing or reversing.
This approach helps you secure profits early, reduce risk, and stay in the trade for larger moves when the trend is strong.
█ Setting Realistic Expectations: Win-Rate and Risk–Reward
Research on breakout systems, trend-following strategies, and directional volatility all show the same behavioral pattern. Win rates tend to be moderate, while risk and reward are positively skewed. Most breakout attempts are tested quickly by the market and may result in small losses or breakeven trades. The real edge comes from the smaller group of breakouts that expand into multi-stage moves and generate significantly larger gains. This is a well-established characteristic of momentum-driven price dynamics.
Momentum Breakout Pro is designed to work within this framework. It is not built to win on every signal, but to highlight conditions that historically align with stronger follow-through. The tool provides structure levels, confirmation lines, and initial target markers to help traders measure extension and manage risk objectively. Actual results will vary depending on the filters enabled, the markets traded, and how stops and exits are managed. However, the overall expectation remains consistent with established breakout research: frequent smaller outcomes combined with fewer but more impactful winners.
█ How It Works
⚪ Breakout System
The breakout system detects emerging directional expansions by transforming price movement into a stabilized signal curve. It evaluates localized impulse strength, directional bias, and short-term acceleration to determine when the price is exerting statistically meaningful pressure in one direction. When this pressure breaches the system’s internal thresholds, a breakout candidate is registered.
Calculation: Price is processed through a multi-stage smoothing pipeline to construct a normalized signal curve. The script analyzes the curve’s gradient and micro-momentum characteristics within a compact evaluation window. A breakout event is triggered when these combined directional metrics exceed the system’s momentum-pressure threshold.
⚪ Momentum Confirmation
To prevent weak or premature breakouts, the system verifies that momentum behavior aligns with the directional expansion. This ensures that only breakouts supported by sustained impulse strength are considered.
Calculation: The script evaluates the strength, stability, and directional consistency of momentum over the developing move. Instead of reacting to isolated shifts, it assesses whether momentum maintains a coherent and persistent trajectory that reinforces the breakout direction. A breakout is confirmed only when momentum structure and directional pressure are synchronized.
⚪ Confirmation Levels
Once a breakout is detected, three confirmation levels indicate how far the price must travel to confirm the breakout's strength.
Calculation: The levels are spaced using a volatility-adjusted distance formula. A breakout is considered strong when the price clears all three levels within a short time window.
⚪ Targets
Targets provide simple reference points for early take profits and risk management.
Calculation: The distance to a nearby structural or volatility-based reference is measured, then projected outward as proportional 1R / 2R style levels.
-----------------
Disclaimer
The content provided in my scripts, indicators, ideas, algorithms, and systems is for educational and informational purposes only. It does not constitute financial advice, investment recommendations, or a solicitation to buy or sell any financial instruments. I will not accept liability for any loss or damage, including without limitation any loss of profit, which may arise directly or indirectly from the use of or reliance on such information.
All investments involve risk, and the past performance of a security, industry, sector, market, financial product, trading strategy, backtest, or individual's trading does not guarantee future results or returns. Investors are fully responsible for any investment decisions they make. Such decisions should be based solely on an evaluation of their financial circumstances, investment objectives, risk tolerance, and liquidity needs.
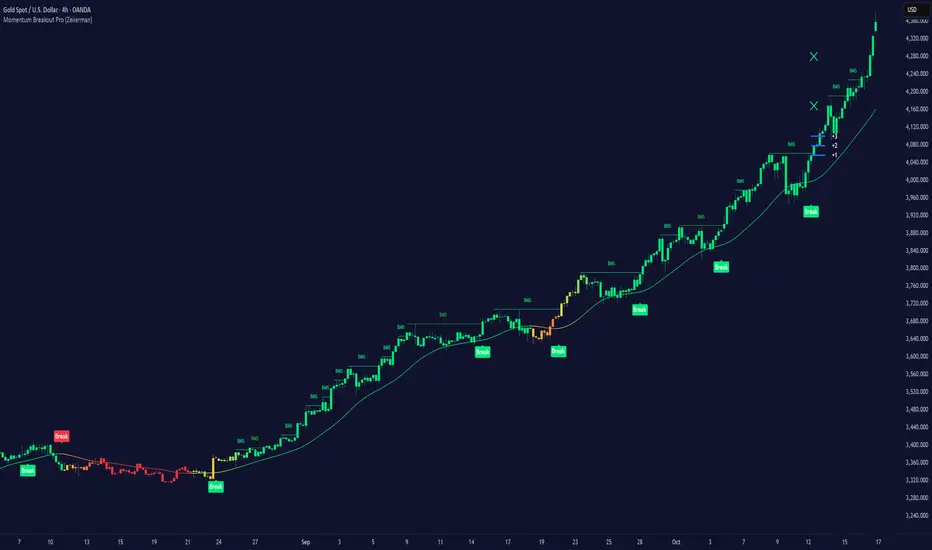
Psychological LevelsADVANCED PSYCHOLOGICAL LEVELS - PROFESSIONAL FOREX INDICATOR
This highly customizable indicator automatically identifies and visualizes all major psychological price levels across any Forex chart. Psychological levels represent critical price zones where traders naturally congregate their orders due to human psychology's attraction to round numbers. These levels consistently act as powerful support and resistance zones in the market.
🎯 KEY FEATURES:
✅ Four Distinct Level Types - Choose from 1000-pip, 100-pip, 50-pip, 25-pip, and 10-pip psychological levels
✅ Individual Color Customization - Each level type has its own customizable zone and line colors
✅ Separate Zone Width Control - Adjust zone width independently for each level type
✅ Universal Forex Compatibility - Automatically adapts to JPY pairs and all other currency pairs
✅ Extended Coverage - Displays levels far beyond the visible chart area for comprehensive analysis
✅ Fixed Positioning - Levels remain stationary when scrolling or zooming
✅ Fully Customizable Styling - Choose between solid, dashed, or dotted line styles
📊 LEVEL TYPES EXPLAINED:
🟣 1000-pip Levels (e.g., EUR/USD: 1.0000, 2.0000 | USD/JPY: 100.00, 110.00, 120.00)
The strongest macro-level psychological barriers in the Forex market
Represent massive institutional, long-term price zones
Extremely important for position traders, swing traders, and macro analysis
Used by hedge funds, banks, and large liquidity providers for major order placement
Ideal for identifying long-term support/resistance, trend reversals, and market structure shifts
Default color: Purple (highest, macro-level importance)
🔴 100-pip Levels (e.g., EUR/USD: 1.1000, 1.1100, 1.1200 | USD/JPY: 150.00, 151.00, 152.00)
The most significant psychological barriers in Forex trading
Major round numbers where institutional traders place large orders
Strongest support and resistance zones with highest reaction probability
Essential for swing trading and position trading strategies
Default color: Red (highest importance)
🟠 50-pip Levels (e.g., EUR/USD: 1.1050, 1.1150, 1.1250 | USD/JPY: 150.50, 151.50, 152.50)
Secondary psychological levels positioned midway between 100-pip levels
Important intermediate zones for profit-taking and order clustering
Highly effective for day trading strategies
Reliable targets for partial profit exits
Default color: Orange (medium-high importance)
🔵 25-pip Levels (e.g., EUR/USD: 1.1025, 1.1075, 1.1125 | USD/JPY: 150.25, 150.75, 151.25)
Quartile levels providing granular market structure
Perfect for scalping and short-term trading approaches
Excellent confluence zones with technical indicators
Ideal for tight stop-loss placement
Default color: Blue (medium importance)
🟢 10-pip Levels (e.g., EUR/USD: 1.1010, 1.1020, 1.1030 | USD/JPY: 150.10, 150.20, 150.30)
Most detailed psychological levels for precision trading
Optimal for micro scalping and high-frequency strategies
Provides fine-grained market structure analysis
Useful for optimizing entry and exit timing
Default color: Green (detailed analysis)
⚙️ CUSTOMIZATION OPTIONS:
Color Settings (Individual for Each Level):
Zone Color - Customize fill color with adjustable transparency
Line Color - Set center line color independently
Default color scheme uses traffic light logic (Purple → Red → Orange → Blue → Green)
Zone Width Settings (Separate for Each Level):
1000-pip Levels: Default 15 pips (widest zones for long-term significance)
100-pip Levels: Default 8 pips (wider zones for major levels)
50-pip Levels: Default 5 pips (medium zones)
25-pip Levels: Default 3 pips (smaller zones)
10-pip Levels: Default 2 pips (narrowest zones for precision)
Display Settings:
Line Style: Choose between Solid, Dashed, or Dotted
Line Thickness: Adjustable from 1 to 5 pixels
Level Selection: Toggle each level type on/off independently
💡 TRADING APPLICATIONS:
📈 Support & Resistance Identification
Instantly recognize where price is likely to react
Identify key reversal zones before they occur
Combine with price action for high-probability setups
🎯 Optimal Entry & Exit Points
Enter trades at psychological support/resistance
Set realistic profit targets at the next psychological level
Improve win rate by trading with market psychology
🛡️ Strategic Stop-Loss Placement
Position stops just beyond psychological levels to avoid stop hunts
Reduce premature stop-outs by understanding where others place stops
Protect profits by moving stops to psychological levels
💰 Profit Target Optimization
Set take-profit orders at psychological levels where profit-taking occurs
Scale out positions at multiple psychological levels
Maximize gains by understanding where demand/supply shifts
📊 Breakout Trading
Identify when price decisively breaks through major psychological barriers
Trade momentum when psychological levels are breached
Confirm breakouts using multiple level types as confluence
⚖️ Risk Management Enhancement
Calculate better risk-reward ratios using psychological levels
Size positions based on distance to next psychological level
Improve overall trading consistency
🔬 WHY PSYCHOLOGICAL LEVELS WORK:
Psychological levels are self-fulfilling prophecies in financial markets. Because thousands of traders worldwide monitor the same round numbers, these levels naturally attract significant order flow:
Order Clustering: Pending buy/sell orders accumulate at round numbers
Profit Taking: Traders instinctively close positions at psychological levels
Stop Hunts: Market makers often push price to psychological levels to trigger stops
Institutional Activity: Banks and funds use round numbers for large order placement
Pattern Recognition: Human brains naturally gravitate toward simple, round numbers
📋 TECHNICAL SPECIFICATIONS:
✓ Pine Script Version 6 (latest)
✓ Compatible with all Forex pairs (majors, minors, exotics)
✓ Works on all timeframes (M1 to Monthly)
✓ Automatic JPY pair detection and adjustment
✓ Maximum 500 lines and 500 boxes for optimal performance
✓ Levels extend infinitely across the chart
✓ No repainting - levels are fixed once drawn
✓ Efficient calculation prevents performance issues
✓ Clean visualization without chart clutter
👥 IDEAL FOR:
Day Traders: Use 100-pip and 50-pip levels for intraday setups
Swing Traders: Focus on major 100-pip levels for multi-day positions
Scalpers: Enable 25-pip and 10-pip levels for precision entries
Position Traders: Use 100-pip levels for long-term support/resistance analysis
Beginner Traders: Learn to recognize important market structure easily
Algorithm Developers: Incorporate psychological levels into automated strategies
🚀 HOW TO USE:
Add the indicator to any Forex chart
Select which level types you want to display (100, 50, 25, 10)
Customize colors to match your chart theme
Adjust zone widths based on your trading style and timeframe
Choose line style (solid, dashed, or dotted)
Watch for price reactions at the highlighted psychological zones
Use the levels to plan entries, exits, and stop-loss placement
💎 BEST PRACTICES:
✓ Combine with candlestick patterns for confirmation signals
✓ Wait for price action confirmation before entering trades
✓ Use multiple timeframes to identify the most significant levels
✓ Disable 10-pip levels on higher timeframes to reduce visual noise
✓ Enable only 100-pip levels for clean, uncluttered analysis on Daily/Weekly charts
✓ Adjust zone widths based on pair volatility (wider for volatile pairs)
✓ Use color coding to instantly recognize level importance
⚡ PERFORMANCE OPTIMIZED:
This indicator is engineered for maximum efficiency:
Smart calculation only within visible price range
Duplicate prevention system avoids overlapping levels
Optimized loops with early break conditions
Extended coverage (500 bars) without performance degradation
Handles thousands of levels across all timeframes smoothly
🎨 VISUAL DESIGN:
The default color scheme follows intuitive importance levels:
Purple (1000-pip): Macro-level, highest significance
Red (100-pip): Highest importance - major barriers
Orange (50-pip): Medium-high importance - secondary levels
Blue (25-pip): Medium importance - tertiary levels
Green (10-pip): Detailed analysis - precision levels
This traffic-light inspired system allows instant visual recognition of level significance.
📚 EDUCATIONAL VALUE:
Beyond being a trading tool, this indicator serves as an excellent educational resource for understanding market psychology and how professional traders think. It visually demonstrates where the "crowd" is likely to place orders, helping you develop better market intuition.
🔄 CONTINUOUS UPDATES:
This indicator displays levels dynamically based on the current price range, ensuring you always see relevant psychological levels no matter where price moves on the chart.
✨ WHAT MAKES THIS INDICATOR UNIQUE:
Unlike simple horizontal line indicators, this advanced tool offers:
Individual customization for each level type (colors, widths)
Automatic currency pair detection and adjustment
Visual zones (not just lines) for better support/resistance visualization
Extended coverage ensuring levels are always visible
Professional color-coding system for instant level importance recognition
Performance-optimized for handling hundreds of levels simultaneously
⭐ PERFECT FOR ALL TRADING STYLES:
Whether you're a conservative position trader looking at weekly charts or an aggressive scalper on 1-minute timeframes, this indicator adapts to your needs. Simply enable the appropriate level types and adjust the visualization to match your strategy.
Transform your Forex trading with professional-grade psychological level analysis. Add this indicator to your chart today and start trading with the market psychology on your side!

Psychological levelsADVANCED PSYCHOLOGICAL LEVELS - PROFESSIONAL FOREX INDICATOR
This highly customizable indicator automatically identifies and visualizes all major psychological price levels across any Forex chart. Psychological levels represent critical price zones where traders naturally congregate their orders due to human psychology's attraction to round numbers. These levels consistently act as powerful support and resistance zones in the market.
🎯 KEY FEATURES:
✅ Four Distinct Level Types - Choose from 100-pip, 50-pip, 25-pip, and 10-pip psychological levels
✅ Individual Color Customization - Each level type has its own customizable zone and line colors
✅ Separate Zone Width Control - Adjust zone width independently for each level type
✅ Universal Forex Compatibility - Automatically adapts to JPY pairs and all other currency pairs
✅ Extended Coverage - Displays levels far beyond the visible chart area for comprehensive analysis
✅ Fixed Positioning - Levels remain stationary when scrolling or zooming
✅ Fully Customizable Styling - Choose between solid, dashed, or dotted line styles
📊 LEVEL TYPES EXPLAINED:
🔴 100-pip Levels (e.g., EUR/USD: 1.1000, 1.1100, 1.1200 | USD/JPY: 150.00, 151.00, 152.00)
The most significant psychological barriers in Forex trading
Major round numbers where institutional traders place large orders
Strongest support and resistance zones with highest reaction probability
Essential for swing trading and position trading strategies
Default color: Red (highest importance)
🟠 50-pip Levels (e.g., EUR/USD: 1.1050, 1.1150, 1.1250 | USD/JPY: 150.50, 151.50, 152.50)
Secondary psychological levels positioned midway between 100-pip levels
Important intermediate zones for profit-taking and order clustering
Highly effective for day trading strategies
Reliable targets for partial profit exits
Default color: Orange (medium-high importance)
🔵 25-pip Levels (e.g., EUR/USD: 1.1025, 1.1075, 1.1125 | USD/JPY: 150.25, 150.75, 151.25)
Quartile levels providing granular market structure
Perfect for scalping and short-term trading approaches
Excellent confluence zones with technical indicators
Ideal for tight stop-loss placement
Default color: Blue (medium importance)
🟢 10-pip Levels (e.g., EUR/USD: 1.1010, 1.1020, 1.1030 | USD/JPY: 150.10, 150.20, 150.30)
Most detailed psychological levels for precision trading
Optimal for micro scalping and high-frequency strategies
Provides fine-grained market structure analysis
Useful for optimizing entry and exit timing
Default color: Green (detailed analysis)
⚙️ CUSTOMIZATION OPTIONS:
Color Settings (Individual for Each Level):
Zone Color - Customize fill color with adjustable transparency
Line Color - Set center line color independently
Default color scheme uses traffic light logic (Red → Orange → Blue → Green)
Zone Width Settings (Separate for Each Level):
100-pip Levels: Default 10 pips (wider zones for major levels)
50-pip Levels: Default 7 pips (medium zones)
25-pip Levels: Default 5 pips (smaller zones)
10-pip Levels: Default 3 pips (narrowest zones for precision)
Display Settings:
Line Style: Choose between Solid, Dashed, or Dotted
Line Thickness: Adjustable from 1 to 5 pixels
Level Selection: Toggle each level type on/off independently
💡 TRADING APPLICATIONS:
📈 Support & Resistance Identification
Instantly recognize where price is likely to react
Identify key reversal zones before they occur
Combine with price action for high-probability setups
🎯 Optimal Entry & Exit Points
Enter trades at psychological support/resistance
Set realistic profit targets at the next psychological level
Improve win rate by trading with market psychology
🛡️ Strategic Stop-Loss Placement
Position stops just beyond psychological levels to avoid stop hunts
Reduce premature stop-outs by understanding where others place stops
Protect profits by moving stops to psychological levels
💰 Profit Target Optimization
Set take-profit orders at psychological levels where profit-taking occurs
Scale out positions at multiple psychological levels
Maximize gains by understanding where demand/supply shifts
📊 Breakout Trading
Identify when price decisively breaks through major psychological barriers
Trade momentum when psychological levels are breached
Confirm breakouts using multiple level types as confluence
⚖️ Risk Management Enhancement
Calculate better risk-reward ratios using psychological levels
Size positions based on distance to next psychological level
Improve overall trading consistency
🔬 WHY PSYCHOLOGICAL LEVELS WORK:
Psychological levels are self-fulfilling prophecies in financial markets. Because thousands of traders worldwide monitor the same round numbers, these levels naturally attract significant order flow:
Order Clustering: Pending buy/sell orders accumulate at round numbers
Profit Taking: Traders instinctively close positions at psychological levels
Stop Hunts: Market makers often push price to psychological levels to trigger stops
Institutional Activity: Banks and funds use round numbers for large order placement
Pattern Recognition: Human brains naturally gravitate toward simple, round numbers
📋 TECHNICAL SPECIFICATIONS:
✓ Pine Script Version 6 (latest)
✓ Compatible with all Forex pairs (majors, minors, exotics)
✓ Works on all timeframes (M1 to Monthly)
✓ Automatic JPY pair detection and adjustment
✓ Maximum 500 lines and 500 boxes for optimal performance
✓ Levels extend infinitely across the chart
✓ No repainting - levels are fixed once drawn
✓ Efficient calculation prevents performance issues
✓ Clean visualization without chart clutter
👥 IDEAL FOR:
Day Traders: Use 100-pip and 50-pip levels for intraday setups
Swing Traders: Focus on major 100-pip levels for multi-day positions
Scalpers: Enable 25-pip and 10-pip levels for precision entries
Position Traders: Use 100-pip levels for long-term support/resistance analysis
Beginner Traders: Learn to recognize important market structure easily
Algorithm Developers: Incorporate psychological levels into automated strategies
🚀 HOW TO USE:
Add the indicator to any Forex chart
Select which level types you want to display (100, 50, 25, 10)
Customize colors to match your chart theme
Adjust zone widths based on your trading style and timeframe
Choose line style (solid, dashed, or dotted)
Watch for price reactions at the highlighted psychological zones
Use the levels to plan entries, exits, and stop-loss placement
💎 BEST PRACTICES:
✓ Combine with candlestick patterns for confirmation signals
✓ Wait for price action confirmation before entering trades
✓ Use multiple timeframes to identify the most significant levels
✓ Disable 10-pip levels on higher timeframes to reduce visual noise
✓ Enable only 100-pip levels for clean, uncluttered analysis on Daily/Weekly charts
✓ Adjust zone widths based on pair volatility (wider for volatile pairs)
✓ Use color coding to instantly recognize level importance
⚡ PERFORMANCE OPTIMIZED:
This indicator is engineered for maximum efficiency:
Smart calculation only within visible price range
Duplicate prevention system avoids overlapping levels
Optimized loops with early break conditions
Extended coverage (500 bars) without performance degradation
Handles thousands of levels across all timeframes smoothly
🎨 VISUAL DESIGN:
The default color scheme follows intuitive importance levels:
Red (100-pip): Highest importance - major barriers
Orange (50-pip): Medium-high importance - secondary levels
Blue (25-pip): Medium importance - tertiary levels
Green (10-pip): Detailed analysis - precision levels
This traffic-light inspired system allows instant visual recognition of level significance.
📚 EDUCATIONAL VALUE:
Beyond being a trading tool, this indicator serves as an excellent educational resource for understanding market psychology and how professional traders think. It visually demonstrates where the "crowd" is likely to place orders, helping you develop better market intuition.
🔄 CONTINUOUS UPDATES:
This indicator displays levels dynamically based on the current price range, ensuring you always see relevant psychological levels no matter where price moves on the chart.
✨ WHAT MAKES THIS INDICATOR UNIQUE:
Unlike simple horizontal line indicators, this advanced tool offers:
Individual customization for each level type (colors, widths)
Automatic currency pair detection and adjustment
Visual zones (not just lines) for better support/resistance visualization
Extended coverage ensuring levels are always visible
Professional color-coding system for instant level importance recognition
Performance-optimized for handling hundreds of levels simultaneously
⭐ PERFECT FOR ALL TRADING STYLES:
Whether you're a conservative position trader looking at weekly charts or an aggressive scalper on 1-minute timeframes, this indicator adapts to your needs. Simply enable the appropriate level types and adjust the visualization to match your strategy.

PIPSTA - Elliott Wave# 🎯 SK-Trading ABC - Stefan Style ULTIMATE
## Overview
This indicator implements an advanced ABC Elliott Wave pattern detection system with the unique "Stefan Style" approach. It identifies high-probability swing trading setups with multiple entry zones, automatic risk-reward calculation, and comprehensive alert system for hands-free trading.
---
## 🔑 Key Features
### 1️⃣ **Intelligent ABC Pattern Recognition**
- Automatic detection of bullish and bearish ABC structures
- Validates retracement ratios (38.2% - 78.6%) for quality setups
- Configurable swing length for different timeframes
- Works on all markets: Forex, Stocks, Crypto, Indices
### 2️⃣ **Dual-Zone Entry System**
#### 🟣 **GKL-Zone (0→A) - Aggressive Entries**
- Available BEFORE pattern activation
- 4 Fibonacci entry levels: 0.5, 0.559, 0.618, 0.667
- For traders who want early positioning
- Purple-colored zone with clear labels
#### 🔵 **BC-Zone (B→A2) - Main Entry System** ⭐
- The "Stefan Style" innovation
- Activates AFTER close breaks Point A
- Tracks A2 (new high/low after activation)
- Entries based on B→A2 retracement (not traditional B→A)
- Tighter risk, better reward ratios
- Blue-colored zone - this is your PRIMARY trading area
### 3️⃣ **Smart Activation Logic**
✅ **Close-Based Activation** (Default)
- Waits for candle CLOSE beyond Point A
- Reduces false breakouts
- More reliable signals
⚡ **A2 Tracking with Locking**
- Monitors new extreme after activation
- Locks A2 on first activation to prevent whipsaws
- Creates stable entry zone
### 4️⃣ **Comprehensive Alert System** 🔔
Never miss a trade with 15+ alert types:
**Setup Alerts:**
- ✅ Pattern Activation (with entry instructions)
- 📍 4 GKL Entry levels (pre-activation)
- 🎯 4 BC-Zone Entry levels (post-activation)
**Trade Management Alerts:**
- 🛑 Stop Loss breach (auto-invalidation)
- 💰 Take Profit 1 (1.618 extension - move to BE)
- 💰 Take Profit 2 (1.809 extension)
- 💰💰 Take Profit 3 (2.0 extension - full target)
All alerts are **alert.freq_once_per_bar** to prevent spam!
### 5️⃣ **Built-in Risk Management**
- Fixed pip-based stop loss (default: 20 pips)
- Minimum RR ratio filter (default: 2.5:1)
- Auto-calculates R-multiples (2R, 3R markers)
- Shows individual RR for each entry level
- Visual SL and TP lines on chart
### 6️⃣ **Professional Dashboard** 📊
Real-time information panel showing:
- ✅ Trade Status: "TRADE BC-ZONE" or "WAIT"
- 📈 Trend Direction
- 🎯 Active Zone (GKL vs BC)
- 💵 All entry levels with prices
- 📍 Stop Loss and Take Profit levels
- 📏 Distance from current price to entries
- ⚖️ Individual RR ratio for each entry
### 7️⃣ **Visual Clarity**
- Color-coded zones and levels
- Clear 0-A-B-C labeling with prices
- "Consumed zones" tracking (grays out touched levels)
- Projection box for C target (1.618-2.0)
- GKL-Box for new cycle after C is reached
- A2 tracking line (dashed orange)
- Trade route arrow visualization
---
## ⚙️ **Settings & Customization**
### Structure Settings
- **Swing Length**: 5-30 (default: 10) - adjust for timeframe
- **Max Sequences**: 1-5 patterns displayed simultaneously
### Display Options
- Toggle C Target Box (1.618-2.0 extension)
- Toggle Activation Line
- Toggle R-Multiple markers
- Toggle GKL-Box after Point C
- Toggle GKL Pre-Activation Zone
- Toggle BC-Zone (main entry area)
### Trade Settings
- **Stop Loss**: 5-100 pips (default: 20)
- **Minimum RR**: 1.0-5.0 (default: 2.5)
### SK System Specific
- ✅ **Close-based Activation**: More reliable than wick breaks
- **Show GKL Pre-Zone**: See aggressive entries before activation
- **Show BC-Zone**: Your main trading area (B→A2)
---
## 📚 **How to Trade This System**
### 🟢 **Conservative Approach** (Recommended)
1. **Wait for Pattern Formation**: 0→A→B structure appears
2. **Wait for Activation Alert**: "🚀 BULLISH/BEARISH ACTIVATED"
3. **Check Dashboard**: Look for "✅ TRADE BC-ZONE"
4. **Set Limit Orders**: In BC-Zone (B→A2) at 0.5, 0.559, 0.618, 0.667 levels
5. **Set Stop Loss**: Below/Above Point B (shown in dashboard)
6. **Set Take Profits**: TP1 (1.618), TP2 (1.809), TP3 (2.0)
7. **Manage Trade**: Move SL to BE at TP1, partial profits at each TP
### ⚡ **Aggressive Approach** (Advanced)
1. **Enter GKL-Zone Pre-Activation**: Use purple zone (0→A retracements)
2. **Risk**: Pattern may not activate
3. **Reward**: Better entry prices if pattern works
4. **Alert**: "🟢/🔴 GKL ENTRY X REACHED - Aggressiv"
### 🎓 **Best Practices**
- ✅ Trade in direction of higher timeframe trend
- ✅ Use multiple entry levels (scale in)
- ✅ Respect minimum RR ratio
- ✅ Let TP3 run for full extension
- ❌ Don't chase after BC-zone is consumed
- ❌ Don't ignore activation requirement
- ❌ Don't trade against major news events
---
## 📊 **Recommended Timeframes**
- **H1 (1-Hour)**: Swing trades, 1-3 day holds
- **H4 (4-Hour)**: Multi-day swings
- **D1 (Daily)**: Position trades, weeks to months
- **Lower timeframes**: Possible but more noise
---
## 🎯 **What Makes This Different?**
### Traditional ABC vs. Stefan Style:
**Traditional ABC:**
- Entries: 50-61.8% retracement of A→B
- Based on original wave measurements
**Stefan Style (This Indicator):**
- Waits for activation (close beyond A)
- Tracks A2 (new extreme after activation)
- Entries: 50-66.7% of B→A2 (the BC-Zone)
- Tighter entries, better RR ratios
- More adaptive to actual price action
### Why BC-Zone Works:
After Point A is broken, the market often makes a new extreme (A2) before retracing. By using B→A2 as your entry reference, you're entering at better prices with tighter stops than traditional methods.
---
## 🔔 **Alert Setup Instructions**
1. Click "Add Alert" on TradingView
2. Condition: Select this indicator
3. Message: Use the built-in alert text (includes prices and instructions)
4. Options: "Once Per Bar Close" (already handled by indicator)
5. Send to: Email, SMS, Webhook, etc.
**You'll receive alerts for:**
- New setups detected
- Activation confirmations
- Entry level touches
- SL breaches
- TP levels reached
---
## 📈 **Performance Tips**
1. **Reduce Visual Load**: Disable unused features in settings
2. **Limit Sequences**: Set Max Sequences to 1-2 for cleaner charts
3. **Timeframe Sync**: Match swing length to your timeframe:
- M15: Swing 5-8
- H1: Swing 8-12
- H4: Swing 10-15
- D1: Swing 12-20
---
## ⚠️ **Disclaimers**
- This indicator is for **educational purposes** only
- Not financial advice - trade at your own risk
- Past performance doesn't guarantee future results
- Always use proper risk management (1-2% per trade)
- Test on demo account first
- Works best in trending conditions, avoid ranging markets
---
## 🛠️ **Technical Details**
- **Pine Script Version**: v6
- **Indicator Type**: Overlay
- **Resources**: Max 150 boxes, 200 lines, 120 labels
- **Pattern Detection**: Pivot-based with ratio validation
- **Alert Frequency**: Once per bar to prevent spam
---
## 📞 **Support & Community**
Join our Telegram channel for:
- Strategy discussions
- Setup examples
- Updates and improvements
- Community support
**Telegram**: @simpleforextools
---
## 🔄 **Version History**
**Current Version**: Ultimate Edition
- ✅ Dual-zone entry system
- ✅ Close-based activation
- ✅ A2 tracking with locking
- ✅ 15+ alert types
- ✅ Consumed zones tracking
- ✅ Professional dashboard
- ✅ RR calculation per entry
- ✅ GKL pre-activation zone
---
## 🏆 **Who Is This For?**
✅ **Perfect for:**
- Swing traders
- Elliott Wave practitioners
- Alert-based traders
- Systematic rule-followers
- Traders who scale into positions
❌ **Not ideal for:**
- Scalpers (too slow)
- Complete beginners (complex system)
- Range-bound market traders
---
## 💡 **Pro Tips**
1. **Confluence is King**: Best results when BC-Zone aligns with:
- Support/Resistance levels
- Fibonacci from higher timeframe
- Round numbers
- Previous structure
2. **Multi-Timeframe Approach**:
- HTF (H4/D1): Identify trend
- LTF (H1): Execute entries
- Use indicator on execution timeframe
3. **Risk Management**:
- Never risk more than 1-2% per trade
- Use multiple entries = divide risk across levels
- Move SL to BE aggressively after TP1

@Unwind Pressure Detector - AUDITED v3.0SQUEEZE → UNWIND PRESSURE DETECTOR v3.0
The first indicator that not only finds oversold squeezes… but tells you exactly when the move is exhausting and it’s time to take profits.
Fully audited, clean Pine Script v6, zero repainting, zero lag tricks.
WHAT IT DOES
• Detects high-probability squeeze setups (RSI + Volume + VIX + Trend confluence)
• Scores pressure from 0–115 with dynamic sensitivity (Low to Extreme)
• Identifies CRITICAL zones where explosive moves are most likely
• Most importantly → flags the UNWIND when trapped shorts are finally covering and the rally is running out of fuel (perfect profit-taking signal)
FEATURES
• Real-time pressure dashboard (top-right)
• Color-coded background zones (Critical = red, High = orange)
• Smart anti-spam labels with ATR offset
• Three alert conditions:
→ Squeeze Setup
→ Critical Squeeze
→ Unwind / Take Profit
• Works on all markets & timeframes (stocks, forex, crypto, futures)
WHY THIS VERSION IS DIFFERENT
- v3.0 completely rewrote the unwind logic (now requires rally + sharp pressure drop)
- No false unwinds during strong trends
- Built for real trading, not just pretty screenshots
100% Open Source • Fully commented • Free to modify & rep, I want this in the public library forever.
Created with love for the TradingView community
Drop a ♥ and follow if you find it useful!
#squeeze #ttmsqueeze #unwind #volatility #vix #takeprofits #smartmoney

Risk Manager Pro – Position Size CalculatorDescription (설명문)
ENGLISH DESCRIPTION (required)
Risk Manager Pro is a professional-grade risk and position management tool designed for crypto traders who need precise control over position sizing, TP/SL targets, and partial take-profit scenarios.
Simply enter your desired Risk ($), Entry, TP, and SL, and the script automatically calculates:
Position size (Qty)
Position value ($)
Full take-profit profit
Risk/Reward ratio (R:R)
Partial TP1 & TP2 profits (optional)
Combined partial profit
Auto-adjusted decimal precision based on each symbol’s syminfo.mintick
This indicator also dynamically builds a clean table on the chart, showing only the values relevant to your setup (TP1/TP2 rows appear only when used).
Works for both long and short trades, and supports any symbol (BTC, altcoins, futures, spot, etc.)
Features
Automatic position size calculation based on Risk$
Auto TP/SL → Profit/R:R calculation
Partial Take-Profit (TP1 / TP2) with percentage control
Auto decimal formatting using format.mintick
Works on all symbols: BTC / alt / futures / spot
Clean dynamic table (no empty rows)
Perfect for traders who use position sizing and risk-based entries
🇰🇷 한국어 설명 (선택 사항)
Risk Manager Pro는 트레이더가 가장 많이 사용하는 핵심 기능들을 통합한
프로페셔널 리스크 관리 도구입니다.
리스크 금액(Risk$), 진입가(Entry), 익절(TP), 손절(SL)을 입력하면
자동으로 다음 값이 계산됩니다:
포지션 수량(코인)
포지션 크기($)
전체 익절 시 수익
손익비(R:R)
부분익절(TP1 / TP2) 수익
부분익절 합계
종목별 소수점 자리 자동 최적화(syminfo.mintick 기반)
TP1/TP2가 입력된 경우에만 해당 줄이 표시되어
표가 깔끔하게 유지됩니다.
비트코인/알트/선물/현물 모두 지원합니다.

Morning ORB FVG Trigger✅ Overview
Morning ORB FVG Trigger is a complete intraday trading framework built around:
A Morning Opening Range Breakout (ORB)
The first Fair Value Gap (FVG) after that breakout
Strict risk management and position sizing
Optional HTF trend filter (Daily / Weekly / Monthly)
Optional Daily ATR filter to avoid extreme days
The script is designed for futures / indices / FX on intraday charts up to 15 minutes and for traders who want a clean, mechanical entry framework with clear risk.
🧠 Core idea
Define a morning opening range (e.g. 09:30–09:45).
Wait for a clean breakout above/below that range.
After the breakout, wait for the first FVG in breakout direction,
confirmed by the next candle (no immediate full reclaim).
Use a chosen stop logic + R:R factor to build risk/reward boxes.
Calculate position size based on your account risk.
(Optional) Only take trades:
In the direction of the HTF EMA trend (D/W/M).
On days where the morning range is within a band of the Daily ATR.
You can also disable all signals/boxes and use the script just as a visual ORB tool.
⏰ 1. ORB / Morning Range
Inputs (Main section)
Morning Range Session
Time window of the opening range in exchange time
Example: 09:30–09:45 for a 15-minute ORB.
You can type custom ranges (e.g. 09:30–09:35 for a 5-minute ORB).
Risk/Reward (TP factor)
Multiplier for the take-profit distance relative to the stop.
2.0 = TP is 2× the stop distance
1.5 = TP is 1.5× the stop distance
Show ORB range
If enabled, draws:
ORB high/low lines
ORB labels (e.g. 15min ORB high / low)
Optional midline
Extend ORB lines to the right (bars)
How many bars to extend the ORB high/low horizontally beyond the ORB itself.
Trade box width (bars)
Horizontal width (in bars) of:
Red risk box (entry–stop)
Green reward box (entry–TP)
Implementation details
The ORB is always calculated on 1-minute data internally, so it stays precise even on 5m/15m charts.
The script only works on intraday timeframes up to 15 minutes.
📦 2. FVG Block
Group: “FVG”
Threshold %
Minimum size of an FVG in % of price.
0 = every FVG
Higher values = only larger gaps
Auto threshold (from volatility)
If enabled, the minimum FVG size is derived from historical volatility
instead of a fixed percentage.
Allow breakout FVG partly inside ORB
Off (default): the FVG must lie fully outside the ORB.
On: the breakout FVG itself may still overlap the ORB a bit,
as long as it is the first one attached to the breakout move.
Enable FVG entry signals, boxes & alerts
On: full system – FVG detection, entry labels, risk/TP boxes, alerts.
Off: no entries, no risk/TP boxes, no alerts.
You only get the ORB and (optionally) the HTF dashboard, so you can trade your own setups.
Entry mode
Entry mode (Mid / Edge / NextOpen)
Mid – Entry at the midpoint of the FVG.
Edge – Long at the upper FVG edge, short at the lower FVG edge.
NextOpen – No limit order in the gap. Entry is placed at the next bar open after FVG confirmation.
Edge offset (ticks)
Additional offset for Edge entries:
Long:
+ticks = a bit above the FVG (more conservative)
-ticks = deeper into the FVG (more aggressive)
Short:
+ticks = a bit below the FVG
-ticks = deeper into the FVG
FVG detection logic
Uses a LuxAlgo-style 3-candle FVG pattern (gap between candle 1 and 3).
Only one FVG is taken: the first valid FVG after the ORB breakout in breakup direction.
The FVG candle is the middle bar; the script:
Detects the FVG on the previous bar.
Waits for the current bar to confirm it:
Bullish: current low must stay above the lower FVG boundary
Bearish: current high must stay below the upper FVG boundary
Only then an entry signal is generated.
🛑 3. Stop Logic
Group: “Stop Logic”
Stop mode (PrevBar / Pivot / FVG Candle)
PrevBar – Stop at the low/high of the candle before the FVG
(tight/aggressive).
FVG Candle – Stop at the low/high of the FVG candle itself
(medium).
Pivot – Stop at the most recent swing high/low
using pivotLeft / pivotRight pivots (more conservative).
Ticks (stop buffer)
Offset (in ticks) from the selected stop level.
> 0 = further away (more room, more risk)
< 0 = closer (tighter stop)
Pivot left / Pivot right
Number of candles left/right to define a swing high/low
when using Pivot stop mode.
Typical intraday values: 2–3.
The script also sanity-checks the stop:
if the calculated stop would be invalid (e.g. above entry in a long), it moves it by a minimal distance (2 ticks) to keep a valid risk.
📈 4. HTF Trend Filter (Daily / Weekly / Monthly)
Group: “HTF Trend Filter”
Enable HTF trend filter
If enabled, trades are only allowed:
Long when at least 2 of D/W/M closes are above their EMA
Short when at least 2 of D/W/M closes are below their EMA
EMA length (D/W/M)
EMA length for all three higher timeframes (Daily, Weekly, Monthly).
This helps focus entries in the direction of the dominant higher-timeframe trend.
📊 5. ATR Filter (Daily)
Group: “ATR Filter (Daily)”
Use daily ATR filter
If enabled, the height of the ORB (ORB high – ORB low) must be within
a band of the Daily ATR to allow any signals.
Daily ATR length
ATR period on the Daily timeframe.
Min ORB size vs ATR
Lower bound:
Example: 0.3 → ORB must be at least 0.3 × Daily ATR
0.0 = no minimum.
Max ORB size vs ATR
Upper bound:
Example: 1.5 → ORB must be ≤ 1.5 × Daily ATR
0.0 = no maximum.
If the ORB is too small (choppy) or too large (exhausted move), no breakout or FVG signal will be generated on that day.
🧭 6. HTF Dashboard & Signal Labels
Group: “HTF Trend Dashboard”
Show HTF dashboard
Draws a small label at the top of the chart showing:
HTF Trend (EMA X)
D: UP/FLAT/DOWN
W: UP/FLAT/DOWN
M: UP/FLAT/DOWN
Dashboard position
Top Right, Top Center, Top Left – places the dashboard at the top.
Over Risk Info – no top dashboard; instead, the HTF trend info is shown as a label near the risk box when a new signal appears.
Lookback (bars) for top anchor
How many bars to use to determine the top price level for dashboard placement.
Show HTF trend above risk box on signal
Only relevant if Dashboard position = Over Risk Info.
When enabled, a small HTF label appears near the risk box for each new trade.
Signal label vertical offset (ticks)
Vertical spacing between risk info label and HTF label.
Minimum spacing HTF/Risk (ticks)
Ensures a minimum vertical distance so the two labels don’t overlap.
HTF signal label X offset (bars)
Horizontal offset (left/right) relative to the risk info label.
⏳ 7. ORB–FVG Filters (Session & Time Window)
Group: “ORB FVG Filter”
Only same session day
If enabled, FVG entries are only allowed on the same calendar day
as the ORB. When the date changes, all state & drawings are reset.
Limit hours after ORB
Enables a time window after the ORB end.
Trading window after ORB (hours)
Length of that window in hours.
Example: 2.0 → FVG signals only in the first 2 hours after ORB end.
💰 8. Risk Management & Position Sizing
Group: “Risk Management”
Calculate position size
If enabled, the script computes suggested mini and micro contract size for you.
Account size
Your trading account size (in account currency).
Risk mode
Percent – risk is a % of account size (Account risk %).
Fixed amount – risk is a fixed dollar amount (Fixed risk ($)).
Account risk %
Risk per trade as a percentage of account size (e.g. 1.0 for 1%).
Fixed risk ($)
Fixed risk per trade in dollars when using Fixed amount mode.
Micro factor (vs mini)
How much a micro contract is worth relative to a mini.
Example:
0.1 → one micro moves 1/10 of one mini.
Risk Info label
For each new trade, a label is shown above the boxes with:
Stop distance in price and $ risk per mini
Max risk allowed for the trade
Suggested mini and micro size
Text like:
Suggested: 2 mini
Suggested: 5 micro
or Suggested: no trade
This makes the script especially useful for prop-firm rules or strict risk discipline.
🎨 9. Visual Style (Boxes, Labels, ORB Lines)
Group: “Box & Label Style (Trade)”
Label font size (Very small, Small, Normal, Large)
Entry label BG / text color
Stop label BG / text color
TP label BG / text color
Risk info BG / text color
Risk box color (entry–stop zone)
Reward box color (entry–TP zone)
Group: “ORB Style”
ORB high line color
ORB low line color
ORB line width
ORB label font size
ORB label background color
ORB label text color
Show ORB midline
ORB midline color / width / style (Solid / Dashed / Dotted)
⚠️ 10. Alerts
Group: “Alerts”
The script defines three alert conditions:
Long entry FVG breakout
Triggered when a new long signal appears.
Short entry FVG breakout
Triggered when a new short signal appears.
FVG entry (long/short)
Generic alert for any new signal (long or short).
To use them:
Add the indicator to the chart.
Open the Alerts dialog → “Condition”.
Select this script and one of the alert conditions.
Set your preferred expiration and notification settings.
Alerts only fire when Enable FVG entry signals, boxes & alerts is on.
🧩 11. How the trading logic flows (summary)
Build ORB on 1-minute data during the selected session.
Optionally reject the day if ORB is outside the ATR bounds.
Wait for a breakout (close above high or below low), respecting HTF trend filter.
After breakout, look for the first valid FVG in that direction:
Outside the ORB (unless breakout FVG allowed inside)
Confirmed by the next candle (no full reclaim)
Once confirmed:
Compute entry, stop, target.
Draw risk/reward boxes and all labels.
Optionally show HTF signal label over the risk info.
Trigger alerts if enabled.
If you disable FVG signals, only steps 1–3 (plus dashboard) are effectively active.
⚠️ 12. Notes & Disclaimer
Script is intended for intraday trading up to 15-minute timeframes.
All signals are mechanical and do not guarantee profitability.
Always backtest and forward-test on your own data before risking real money.
This script is for educational purposes only and is not financial advice.
🚀 Quick-start guide
Add the script to your chart
Use an intraday timeframe ≤ 15 minutes (1m, 3m, 5m, 15m).
Works best on liquid indices, futures, FX and large-cap stocks.
Set the Morning Range
In “Morning Range Session” choose the exchange’s opening window.
Examples
US index futures (CME): 08:30–08:45 or 08:30–08:35
US stocks (NYSE/Nasdaq): 09:30–09:45 or 09:30–09:35
The ORB is always calculated on 1-minute data internally, so the range stays accurate on higher intraday charts.
Keep the default filters at first
HTF Trend Filter: ON
EMA length = 20
This will only allow trades in the direction of the dominant D/W/M trend.
ATR Filter: OFF (optional; you can enable later once you’re comfortable).
Use the full trade system
In the FVG group leave
“Enable FVG entry signals, boxes & alerts” = ON
Entry mode: Mid
Stop mode: FVG Candle or PrevBar
Risk/Reward: 2.0 as a starting point.
Set your risk
Turn on “Calculate position size”.
Enter your Account size and choose either:
Risk mode = Percent (e.g. 1.0 = 1% per trade), or
Risk mode = Fixed amount (e.g. $250 per trade).
The risk info label will show:
Stop distance in price and $/contract
Max allowed risk
Suggested mini and micro contract size.
Enable alerts (optional)
Open the Alerts dialog → Condition: this script.
Choose one of:
Long entry FVG breakout
Short entry FVG breakout
FVG entry (long/short)
Choose “Once per bar” or “Once per bar close”, and your preferred notification type.
Replay & journal
Use the TradingView bar replay tool to step through past days.
Focus on:
How the ORB defines the structure.
How the first confirmed FVG outside the ORB behaves.
Whether the risk/TP levels fit your own style and product.
🎛 Recommended settings & profiles
These are starting points, not rules. Always adapt to the instrument and your own risk tolerance.
1. Conservative / Trend-following
Timeframe: 5m or 15m
Morning Range Session: 15-minute ORB around the cash or futures open
FVG
Threshold %: 0.05–0.1 (filter out very small gaps)
Auto threshold: OFF (keep it simple)
Allow breakout FVG partly inside ORB: OFF
Enable FVG entry signals/boxes/alerts: ON
Entry mode: Mid
Stop Logic
Stop mode: Pivot
Pivot left/right: 2–3
Stop buffer: +1–2 ticks
HTF Trend Filter
Enabled: ON
EMA length: 20
ATR Filter
Enabled: ON
Daily ATR length: 14
Min ORB vs ATR: 0.3–0.4
Max ORB vs ATR: 1.2–1.5
Risk Management
Risk mode: Percent
Account risk: 0.5–1.0%
Idea: Only trade when the higher-timeframe trend supports the move and the opening range is of a “normal” size for the current volatility.
2. Balanced / Intraday directional
Timeframe: 3m or 5m
FVG
Threshold %: 0.02–0.05
Auto threshold: ON (lets the script adapt to volatility)
Allow breakout FVG partly inside ORB: ON
(first breakout FVG may partly sit inside the ORB)
Entry mode: Edge
Edge offset (ticks): 0 or +1
Stop Logic
Stop mode: FVG Candle
Stop buffer: 0–1 ticks
HTF Trend Filter
Enabled: ON
ATR Filter
Enabled: OFF (optional)
Risk Management
Risk mode: Percent
Account risk: 1.0–1.5% (if this fits your plan)
Idea: Slightly more aggressive entries at the gap edge, still aligned with HTF trend, but with more flexibility on ATR.
3. Aggressive / Scalping around the ORB
Timeframe: 1m or 3m
FVG
Threshold %: 0.0–0.02
Auto threshold: ON
Allow breakout FVG partly inside ORB: ON
Entry mode: NextOpen or Edge with a negative offset (deeper into the gap)
Stop Logic
Stop mode: PrevBar
Stop buffer: 0 or -1 tick
HTF Trend Filter
Enabled: OFF (or ON but treat as soft guidance)
ATR Filter
Enabled: OFF
Risk Management
Risk mode: Percent
Account risk: lower, e.g. 0.25–0.5% per trade
Idea: More trades and tighter stops. Best for experienced traders who understand the limitations of scalping and whipsaw risk.
Final reminder
All of these are templates, not guarantees:
Always check how the system behaves on your market and session.
Start on replay and demo before trading real money.
Adjust filters (HTF, ATR, thresholds) until the signals fit your personal approach.

Session Open Range, Breakout & Trap Framework - TrendPredator OBSession Open Range, Breakout & Trap Framework — TrendPredator Open Box
Stacey Burke’s trading approach combines concepts from George Douglas Taylor, Tony Crabel, Steve Mauro, and Robert Schabacker. His framework focuses on reading price behaviour across daily templates and identifying how markets move through recurring cycles of expansion, contraction, and reversal. While effective, much of this analysis requires real-time interpretation of session-based behaviour, which can be demanding for traders working on lower intraday timeframes.
The TrendPredator indicators formalize parts of this methodology by introducing mechanical rules for multi-timeframe bias tracking and session structure analysis. They aim to present the key elements of the system—bias, breakouts, fakeouts, and range behaviour—in a consistent and objective way that reduces discretionary interpretation.
The Open Box indicator focuses specifically on the opening behaviour of major trading sessions. It builds on principles found in classical Open Range Breakout (ORB) techniques described by Tony Crabel, where a defined time window around the session open forms a structural reference range. Price behaviour relative to this range—breaking out, failing back inside, or expanding—can highlight developing session bias, potential trap formation, and directional conviction.
This indicator applies these concepts throughout the major equity sessions. It automatically maps the session’s initial range (“Open Box”) and tracks how price interacts with it as liquidity and volatility increase. It also incorporates related structural references such as:
* the first-hour high and low of the futures session
* the exact session open level
* an anchored VWAP starting at the session open
* automated expansion levels projected from the Open Box
In combination, these components provide a unified view of early session activity, including breakout attempts, fakeouts, VWAP reactions, and liquidity targeting. The Open Box offers a structured lens for observing how price transitions through the major sessions (Asia → London → New York) and how these behaviours relate to higher-timeframe bias defined in the broader TrendPredator framework.
Core Features
Open Box (Session Structure)
The indicator defines an initial session range beginning at the selected session open. This “Open Box” represents a fixed time window—commonly the first 30 minutes, or any user-defined duration—that serves as a structural reference for analysing early session behaviour.
The range highlights whether price remains inside the box, breaks out, or rejects the boundaries, providing a consistent foundation for interpreting early directional tendencies and recognising breakout, continuation, or fakeout characteristics.
How it works:
* At the session open, the indicator calculates the high and low over the specified time window.
* This range is plotted as the initial structure of the session.
* Price behaviour at the boundaries can illustrate emerging bias or potential trap formation.
* An optional secondary range (e.g., 15-minute high/low) can be enabled to capture early volatility with additional precision.
Inputs / Options:
* Session specifications (Tokyo, London, New York)
* Open Box start and end times (e.g., equity open + first 30 minutes, or any custom length)
* Open Box colour and label settings
* Formatting options for Open Box high and low lines
* Optional secondary range per session (e.g., 15-minute high/low)
* Forward extension of Open Box high/low lines
* Number of historic Open Boxes to display
Session VWAPs
The indicator plots VWAPs for each major trading session—Asia, London, and New York—anchored to their respective session opens. These session-specific VWAPs assist in tracking how value develops through the day and how price interacts with session-based volume distributions.
How it works:
* At each session open, a VWAP is anchored to the open price.
* The VWAP updates throughout the session as new volume and price data arrive.
* Deviations above or below the VWAP may indicate balance, imbalance, or directional control.
* Viewed together, session VWAPs help identify transitions in value across sessions.
Inputs / Options:
* Enable or disable VWAP per session
* Adjustable anchor and end times (optionally to end of day)
* Line styling and label settings
* Number of historic VWAPs to draw
First Hour High/Low Extensions
The indicator marks the high and low formed during the first hour of each session. These reference points often function as early control levels and provide context for assessing whether the session is establishing bias, consolidating, or exhibiting reversal behaviour.
How it works:
* After the session starts, the indicator records the highest and lowest prices during the first hour.
* These levels are plotted and extended across the session.
* They provide a visual reference for observing reactions, targets, or rejection zones.
Inputs / Options:
* Enable or disable for each session
* Line style, colour, and label visibility
* Number of historic sessions displayed
EQO Levels (Equity Open)
The indicator plots the opening price of each configured session. These “Equity Open” levels represent short-term reference points that can attract price early in the session.
Once the level is revisited after the Open Box has formed, it is automatically cut to avoid clutter. If not revisited, the line remains as an untested reference, similar to a naked point of control.
How it works:
* At session open, the open price is recorded.
* The level is plotted as a local reference.
* If price interacts with the level after the Open Box completes, the line is cut.
* Untested EQOs extend forward until interacted with.
Inputs / Options:
* Enable/disable per session
* Line style and label settings
* Optional extension into the next day
* Option for cutting vs. hiding on revisit
* Number of historic sessions displayed
OB Range Expansions (Automatic)
Range expansions are calculated from the height of the Open Box. These levels provide structured reference zones for identifying potential continuation or exhaustion areas within a session.
How it works:
* After the Open Box is formed, multiples of the range (e.g., 1×, 2×, 3×) are projected.
* These expansion levels are plotted above and below the range.
* Price reactions near these areas can illustrate continuation, hesitation, or potential reversal.
Inputs / Options:
* Enable or disable per session
* Select number of multiples
* Line style, colour, and label settings
* Extension length into the session
Stacey Burke 12-Candle Window Marker
The indicator can highlight the 12-candle window often referenced in Stacey Burke’s session methodology. This window represents the key active period of each session where breakout attempts, volatility shifts, and reversal signatures often occur.
How it works:
* A configurable window (default 12 candles) is highlighted from each session open.
* This window acts as a guide for observing active session behaviour.
* It remains visible throughout the session for structural context.
Inputs / Options:
* Enable/disable per session
* Configurable window duration (default: 3 hours)
* Colour and transparency controls
Concept and Integration
The Open Box is built around the same multi-timeframe logic that underpins the broader TrendPredator framework.
While higher-timeframe tools track bias and setups across the H8–D–W–M levels, the Open Box focuses on the H1–M30 domain to define session structure and observe how early intraday behaviour aligns with higher-timeframe conditions.
The indicator integrates with the TrendPredator FO (Breakout, Fakeout & Trend Switch Detector), which highlights microstructure signals on lower timeframes (M15/M5). Together they form a layered workflow:
* Higher timeframes: context, bias, and developing setups
* TrendPredator OB: intraday and intra-session structure
* TrendPredator FO: microstructure confirmation (e.g., FOL/FOH, switches)
This alignment provides a structured way to observe how daily directional context interacts with intraday behaviour.
See the public open source indicator TP FO here (click on it for access):
Practical Application
Before Session Open
* Review previous session Open Box, Open level, and VWAPs
* Assess how higher-timeframe bias aligns with potential intraday continuation or reversal
* Note untested EQO levels or VWAPs that may function as liquidity attractors
During Session Open
* Observe behaviour around the first-hour high/low and higher-timeframe reference levels
* Monitor how the M15 and 30-minute ranges close
* Track reactions relative to the session open level and the session VWAP
After the Open Box completes
* Assess price interaction with Open Box boundaries and first-hour levels
* Use microstructure signals (e.g., FOH/FOL, switches) for potential confirmation
* Refer to expansion levels as reference zones for management or target setting
After Session
* Review how price behaved relative to the Open Box, EQO levels, VWAPs, and expansion zones
* Analyse breakout attempts, fakeouts, and whether intraday structure aligned with the broader daily move
Example Workflow and Trade
1. Higher-timeframe analysis signals a Daily Fakeout Low Continuation (bullish context).
2. The New York session forms an Open Box; price breaks above and holds above the first-hour high.
3. A Fakeout Low + Switch Bar appears on M5 (via FO), after retesting the session VWAP triggering the entry.
4. 1x expansion level serves as reference targets for take profit.
Relation to the TrendPredator Ecosystem
The Open Box is part of the TrendPredator Indicator Family, designed to apply multi-timeframe logic consistently across:
* higher-timeframe context and setups
* intraday and session structure (OB)
* microstructure confirmation (FO)
Together, these modules offer a unified structure for analysing how daily and intraday cycles interact.
Disclaimer
This indicator is for educational purposes only and does not guarantee profits.
It does not provide buy or sell signals but highlights structural and behavioural areas for analysis.
Users are solely responsible for their trading decisions and outcomes.

Dumb Money Flow - Retail Panic & FOMO# Dumb Money Flow (DMF) - Retail Panic & FOMO
## 🌊 Overview
**Dumb Money Flow (DMF)** is a powerful **contrarian indicator** designed to track the emotional state of the retail "herd." It identifies moments of extreme **Panic** (irrational selling) and **FOMO** (irrational buying) by analyzing on-chain data, volume anomalies, and price velocity.
In crypto markets, retail traders often buy the top (FOMO) and sell the bottom (Panic). This indicator helps you do the opposite: **Buy when the herd is fearful, and Sell when the herd is greedy.**
---
## 🧠 How It Works
The indicator combines multiple data points into a single **Sentiment Index** (0-100), normalized over a 90-day period to ensure it always uses the full range of the chart.
### 1. Panic Index (Bearish Sentiment)
Tracks signs of capitulation and fear. High values contribute to the **Panic Zone**.
* **Exchange Inflows:** Spikes in funds moving to exchanges (preparing to sell).
* **Volume Spikes:** High volume during price drops (panic selling).
* **Price Crash (ROC):** Rapid, emotional price drops over 3 days.
* **Volatility (ATR):** High market nervousness and instability.
### 2. FOMO Index (Bullish Sentiment)
Tracks signs of euphoria and greed. High values contribute to the **FOMO Zone**.
* **Exchange Outflows:** Funds moving to cold storage (HODLing/Greed).
* **Profitable Addresses:** When >90% of holders are in profit, tops often form.
* **Parabolic Rise:** Rapid, unsustainable price increases.
---
## 🎨 Visual Guide
The indicator uses a distinct color scheme to highlight extremes:
* **🟢 Dark Green Zone (> 80): Extreme FOMO**
* **Meaning:** The crowd is euphoric. Risk of a correction is high.
* **Action:** Consider taking profits or looking for short entries.
* **🔴 Dark Burgundy Zone (< 20): Extreme Panic**
* **Meaning:** The crowd is capitulating. Prices may be oversold.
* **Action:** Look for buying opportunities (catching the knife with confirmation).
* **🔵 Light Blue Line:**
* The smoothed moving average of the sentiment, helpful for seeing the trend direction.
---
## 🛠️ How to Use (Trading Strategies)
### 1. Contrarian Reversals (The Primary Strategy)
* **Buy Signal:** Wait for the line to drop deep into the **Burgundy Panic Zone (< 20)** and then start curling up. This indicates that the worst of the selling pressure is over.
* **Sell Signal:** Wait for the line to spike into the **Green FOMO Zone (> 80)** and then start curling down. This suggests buying exhaustion.
### 2. Divergences
* **Bullish Divergence:** Price makes a **Lower Low**, but the DMF Indicator makes a **Higher Low** (less panic on the second drop). This is a strong reversal signal.
* **Bearish Divergence:** Price makes a **Higher High**, but the DMF Indicator makes a **Lower High** (less FOMO/buying power on the second peak).
### 3. Trend Confirmation (Midline Cross)
* **Crossing 50 Up:** Sentiment is shifting from Fear to Greed (Bullish).
* **Crossing 50 Down:** Sentiment is shifting from Greed to Fear (Bearish).
---
## ⚙️ Settings
* **Data Source:** Defaults to `INTOTHEBLOCK` for on-chain data.
* **Crypto Asset:** Auto-detects BTC/ETH, but can be forced.
* **Normalization Period:** Default 90 days. Determines the "window" for defining what is considered "Extreme" relative to recent history.
* **Weights:** You can customize how much each factor (Volume, Inflows, Price) contributes to the index.
---
**Disclaimer:** This indicator is for educational purposes only. "Dumb Money" analysis is a probability tool, not a crystal ball. Always manage your risk.
**Indicator by:** @iCD_creator
**Version:** 1.0
**Pine Script™ Version:** 6
---
## Updates & Support
For questions, suggestions, or bug reports, please comment below or message the author.
**Like this indicator? Leave a 👍 and share your feedback!**

Advanced Trading System - Volume Profile + BB + RSI + FVG + FibAdvanced Multi-Indicator Trading System with Volume Profile, Bollinger Bands, RSI, FVG & Fibonacci
Overview
This comprehensive trading indicator combines five powerful technical analysis tools into one unified system, designed to identify high-probability trading opportunities with precision entry and exit signals. The indicator integrates Volume Profile analysis, Bollinger Bands, RSI momentum, Fair Value Gaps (FVG), and Fibonacci retracement levels to provide traders with a complete market analysis framework.
Key Features
1. Volume Profile & Point of Control (POC)
Automatically calculates the Point of Control - the price level with the highest trading volume
Identifies Value Area High (VAH) and Value Area Low (VAL)
Updates dynamically based on customizable lookback periods
Helps identify key support and resistance zones where institutional traders are active
2. Bollinger Bands Integration
Standard 20-period Bollinger Bands with customizable multiplier
Identifies overbought and oversold conditions
Measures market volatility through band width
Signals generated when price approaches extreme levels
3. RSI Momentum Analysis
14-period Relative Strength Index with visual background coloring
Overbought (70) and oversold (30) threshold alerts
Integrated into buy/sell signal logic for confirmation
Real-time momentum tracking in info dashboard
4. Fair Value Gap (FVG) Detection
Automatically identifies bullish and bearish fair value gaps
Visual representation with colored boxes
Highlights imbalance zones where price may return
Used for high-probability entry confirmation
5. Fibonacci Retracement Levels
Auto-calculated based on recent swing high/low
Key levels: 23.6%, 38.2%, 50%, 61.8%, 78.6%
Perfect for identifying profit-taking zones
Dynamic lines that update with market movement
6. Smart Signal Generation
The indicator generates BUY and SELL signals based on multi-condition confluence:
BUY Signal Requirements:
Price near lower Bollinger Band
RSI in oversold territory (< 30)
High volume confirmation (optional)
Bullish FVG or POC alignment
SELL Signal Requirements:
Price near upper Bollinger Band
RSI in overbought territory (> 70)
High volume confirmation (optional)
Bearish FVG or POC alignment
7. Automated Take Profit Levels
Three dynamic profit targets: 1%, 2%, and 3%
Automatically calculated from entry price
Visual markers on chart
Individual alerts for each level
8. Comprehensive Alert System
The indicator includes 10+ alert types:
Buy signal alerts
Sell signal alerts
Take profit level alerts (TP1, TP2, TP3)
Fibonacci level cross alerts
RSI overbought/oversold alerts
Bullish/Bearish FVG detection alerts
9. Real-Time Info Dashboard
Live display of all key metrics
Color-coded for quick visual analysis
Shows RSI, BB Width, Volume ratio, POC, Fib levels
Current signal status (BUY/SELL/WAIT)
How to Use
Setup
Add the indicator to your chart
Adjust parameters based on your trading style and timeframe
Set up alerts by clicking "Create Alert" and selecting desired conditions
Recommended Timeframes
Scalping: 5m - 15m
Day Trading: 15m - 1H
Swing Trading: 4H - Daily
Parameter Customization
Volume Profile Settings:
Length: 100 (adjust for more/less historical data)
Rows: 24 (granularity of volume distribution)
Bollinger Bands:
Length: 20 (standard period)
Multiplier: 2.0 (adjust for tighter/wider bands)
RSI Settings:
Length: 14 (standard momentum period)
Overbought: 70
Oversold: 30
Fibonacci:
Lookback: 50 (swing high/low detection period)
Signal Settings:
Volume Filter: Enable/disable volume confirmation
Volume MA Length: 20 (for volume comparison)
Trading Strategy Examples
Strategy 1: Trend Reversal
Wait for BUY signal at lower Bollinger Band
Confirm with bullish FVG or POC support
Enter position
Take partial profits at Fib 38.2% and 50%
Exit remaining position at TP3 or SELL signal
Strategy 2: Breakout Confirmation
Monitor price approaching POC level
Wait for volume spike
Enter on signal confirmation with FVG alignment
Use Fibonacci levels for scaling out
Strategy 3: Range Trading
Identify POC as range midpoint
Buy at lower BB with oversold RSI
Sell at upper BB with overbought RSI
Use FVG zones for additional confirmation
Best Practices
✅ Do:
Use multiple timeframe analysis
Combine with price action analysis
Set stop losses below/above recent swing points
Scale out at Fibonacci levels
Wait for volume confirmation on signals
❌ Don't:
Trade every signal blindly
Ignore overall market context
Use on extremely low timeframes without testing
Neglect risk management
Trade during low liquidity periods
Risk Management
Always use stop losses
Risk no more than 1-2% per trade
Consider market conditions and volatility
Scale position sizes based on signal strength
Use the volume filter for additional confirmation
Technical Specifications
Pine Script Version: 6
Overlay: Yes (displays on main chart)
Max Boxes: 500 (for FVG visualization)
Max Lines: 500 (for Fibonacci levels)
Alerts: 10+ customizable conditions
Performance Notes
This indicator works best in:
Trending markets with clear momentum
High-volume trading sessions
Assets with good liquidity
When multiple signals align
Less effective in:
Extremely choppy/sideways markets
Low-volume periods
During major news events (high volatility)
Updates & Support
This indicator is actively maintained and updated. Future enhancements may include:
Additional volume profile features
More sophisticated FVG tracking
Enhanced alert customization
Backtesting integration
Disclaimer
This indicator is for educational and informational purposes only. It does not constitute financial advice. Past performance does not guarantee future results. Always conduct your own research and consider consulting with a financial advisor before making trading decisions. Trading involves substantial risk of loss.

1MN Profitcosmos Gold Scalping📈 Profitcosmos Gold Scalping Indicator (1MN)
The Profitcosmos Gold Scalping Indicator is a high-precision scalping system designed specifically for XAUUSD (Gold) on the 1-minute timeframe. It blends ATR-based trend logic with smart session filtering to detect only the most actionable trading opportunities during high-liquidity market hours.
This indicator is built for traders who demand clean entries, structured risk management, and disciplined execution.
✅ Core Features
🔹 ATR Dynamic Stop System
Uses adaptive volatility-based trailing logic to detect strong directional moves.
🔹 Session-Based Trading Only
Trades are filtered to execute exclusively during high-probability sessions:
London Session
New York Session
Asian Session
🔹 Visual Trade Guidance
Every signal automatically draws:
✅ Entry level
🔴 Stop Loss (Swing-based)
🟢 Take Profit (3R risk-reward)
🔹 Clear BUY / SELL Markers
BUY below candle (arrow pointing up)
SELL above candle (arrow pointing down)
No confusion. No overtrading. Only precision.
🔹 Optional Heikin Ashi Mode
Smooth price data for cleaner trend detection.
🎯 How To Trade (Rules)
✅ Trade BUY signals only when price is trending up
✅ Trade SELL signals only when price is trending down
✅ Respect the Stop Loss and Take Profit levels
✅ Never revenge trade
✅ Focus on quality over quantity
🛡 Risk Management
Each signal follows a 3:1 reward-to-risk ratio, ensuring long-term profitability when combined with discipline and consistency.
⚠️ Disclaimer
This indicator is not financial advice. Trading involves risk. Use proper money management and test strategies on demo accounts before trading live capital.
